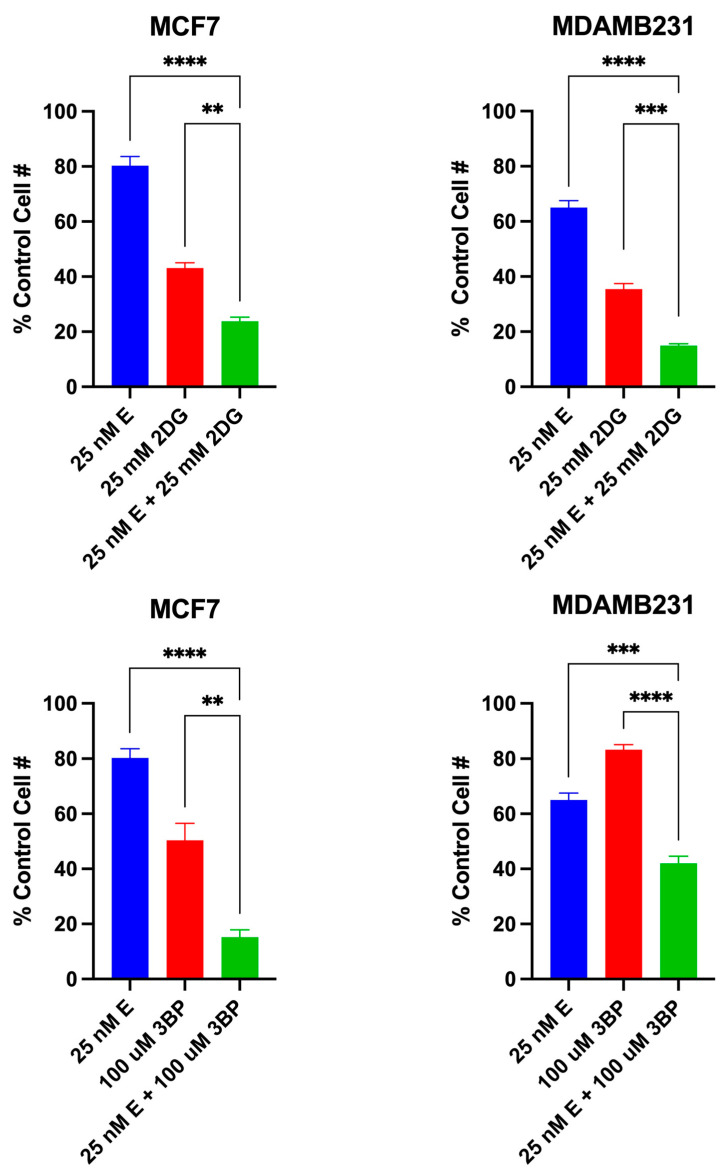
Figure 6.
The additive cytotoxic effect of the test combinations. The data points represent the average values obtained for 3–6 separate experiments, +/− S.E. Statistical analysis was performed using an ordinary one-way ANOVA analysis followed by Tukey’s multiple comparisons test. The threshold for statistical significance was set to ** p < 0.01, *** p < 0.001, **** p < 0.0001.

