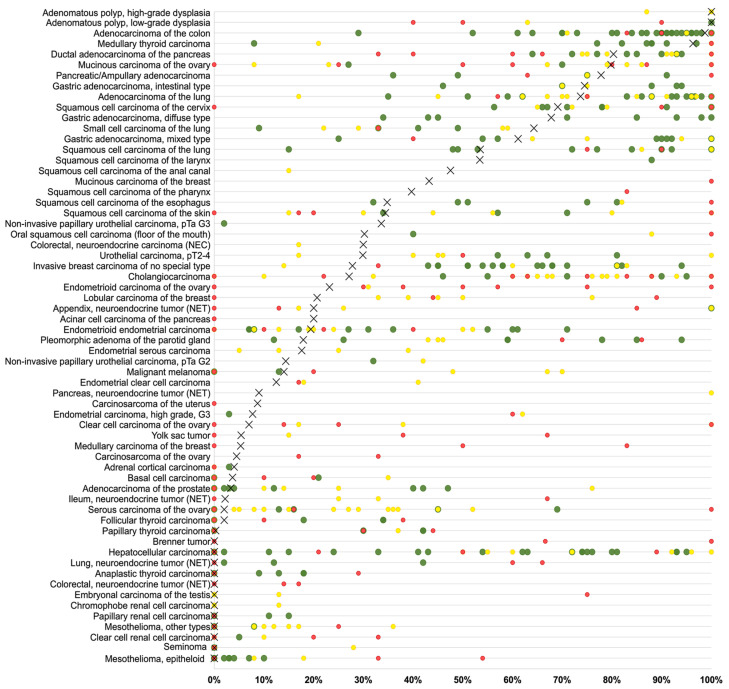
Figure 5.
Comparison of CEA expression with previous works in the literature. An “X” represents the proportion of CEA-positive cancers in the present study, dots indicate the frequencies reported in the literature for comparison: studies with ≤10 tumors analyzed are marked with red dots, studies with 11 to 25 tumors analyzed are marked with yellow dots, and green dots mark studies with >25 tumors analyzed.

