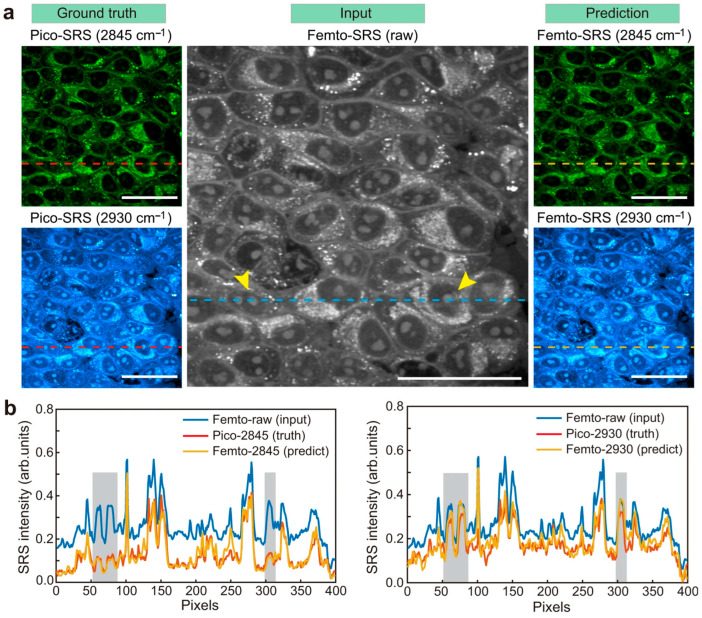
Figure 3.
(a) Deep U-Net based Femto-SRS imaging originally acquired Pico-SRS images of two channels (ground truth): the single channel Femto-SRS raw image (input), and the U-Net based prediction. Scale bars: 50 µm. (b) Intensity profiles corresponding to the dashed lines in (a) of the predicted and ground-truth data, showing chemical contrast in the cell nucleus regions (marked in yellow arrows (a) and in grey (b). (Source Liu et al. [85]).

