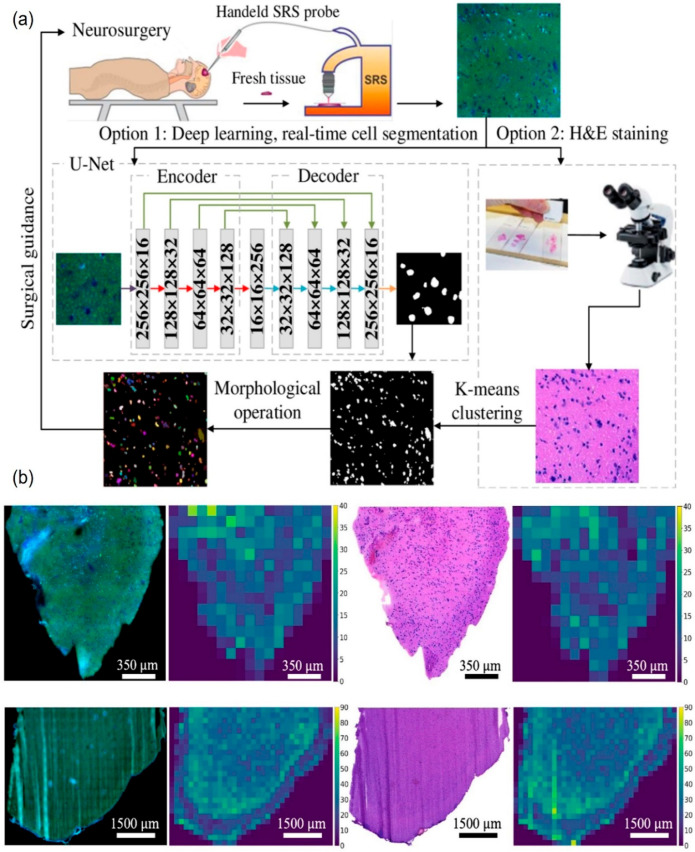
Figure 4.
(a) The process flow of the SRH analysis. The tissue extracted during excision surgery was analyzed using SRH and H&E analysis. SRH image analysis was performed using U-Net as option 1. Option 2 performs H&E staining and subsequent analysis using K-means clustering. The outputs from option 1 and option 2 were subjected to morphological operation. (b) Cell segmentation and identification results in a FOV, where the number of cells for each patch is mapped to visualize cell distribution within a sample (Adopted from Zhang et al. [103]).

