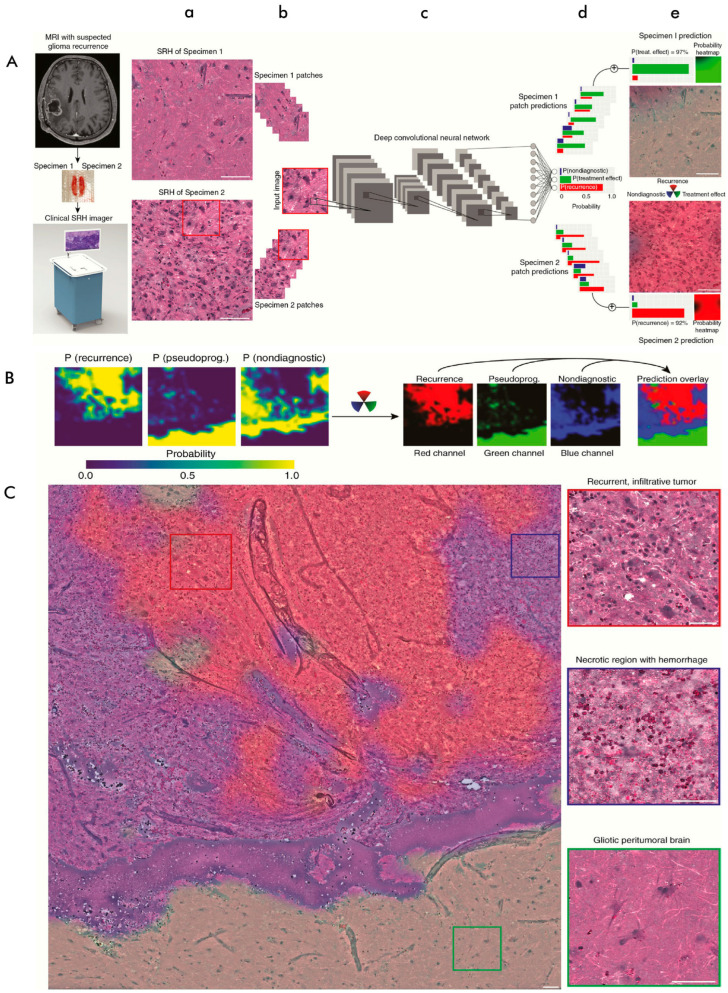
Figure 5.
(A) (a–d) The SRH and CNN workflow for the automated detection of recurrent glioma. (a) A 1 × 1-mm SRH image is captured in about 60 s, (b) which gets split into 300 × 300-pixel patches using a dense sliding window method. (c) Each patch is analyzed by a feedforward CNN. (d) The final softmax layer produces a categorical probability distribution across classes: recurrence, pseudo-progression/treatment effect, and nondiagnostic. (e) An aggregation algorithm aggregates patch-level prediction probabilities to yield a single probability of recurrence for each specimen or patient. Scale bars = 50 μm. (B) Probability heatmaps for each of the three output classes are generated using patch-level predictions obtained from a dense, overlapping sliding window algorithm. This method ensures that each pixel in the image has a corresponding probability distribution, resulting in high-resolution, smoother heatmaps. (C) Each heatmap is assigned to an RGB channel, producing an overlay of predictions on the entire SRH slide. An SRH image from a patient with recurrent glioblastoma is shown, where dense tumor areas (red) are highlighted alongside nondiagnostic regions such as hemorrhagic and necrotic tissue (blue) and gliotic brain tissue (green). This semantic segmentation technique enhances the interpretation of SRH images by combining CNN predictions with spatial information about recurrent tumor areas. Scale bars = 50 μm (adopted from Hollon et al. [91]).

