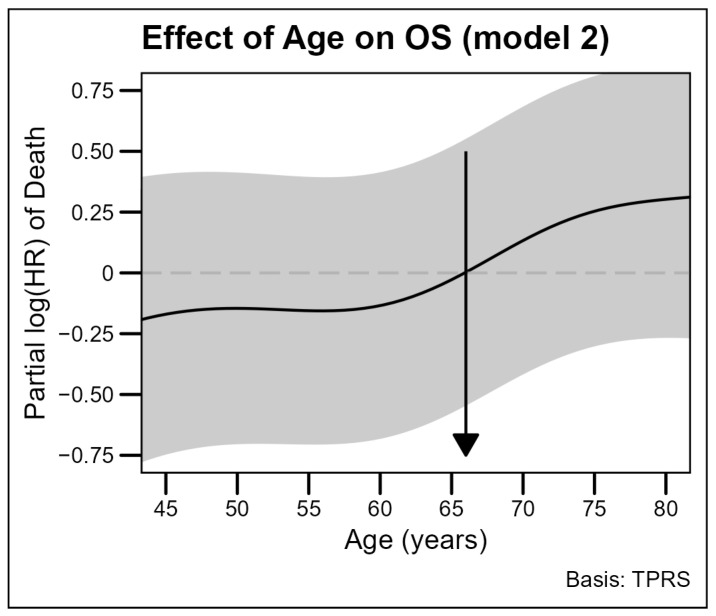
Figure 3.
The effect of increasing age on overall survival in the adjusted model. The solid line represents the estimated log hazard ratios (log HRs) for age, pictures the relationship between patients’ age and overall survival (OS) in a cohort of 1514 patients. The impact of age on mortality risk was analyzed with a penalized spline (P-spline) model, treating patients’ age as a continuous covariate. Abbreviation: OS, overall survival, HR, hazard ratio.

