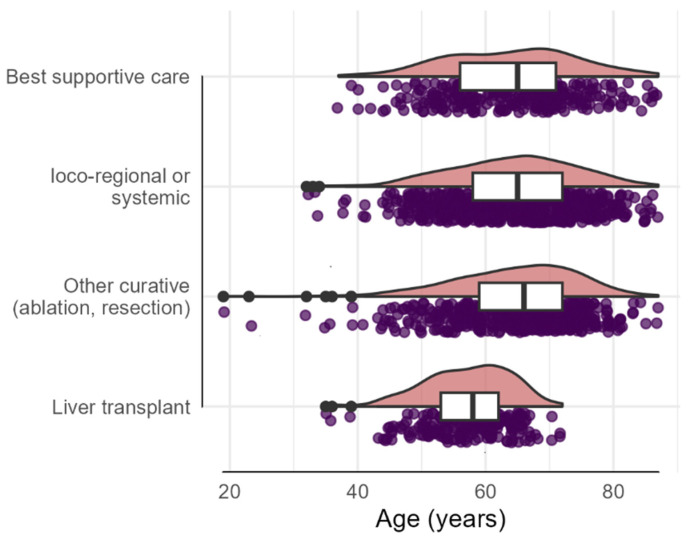
Figure 4.
The distribution of treatment modalities across different age groups in HCC patients. On the x-axis is represented the patient age, and the y-axis lists the treatment: best supportive care, loco-regional (SIRT, TACE, TAE, SBRT) or systemic therapies (TKI, tyrosine kinase inhibitor (i.e., Sorafenib, Lenvatinib) and immunotherapy (i.e., nivolumab, pembrolizumab, atezolizumab/bevacizumab)), other curative therapies (ablation/resection), and liver transplantation. Each dot represents an individual patient. The pink density plots show the concentration of patients within each age range. The black line within the boxplots (white) indicates median age per group and the interquartile range (edges of the white boxes). The black dots represent outliers.

