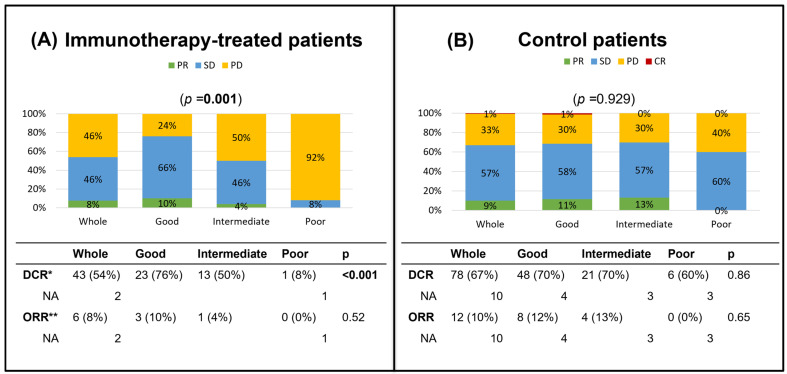
Figure 1.
Barplot of responses by LIPI group from the immunotherapy and control cohorts. (A) Best response by LIPI score in the immunotherapy cohort. (B) Best response by LIPI score in the control cohort. * Disease control rate = stable disease + partial response + complete response. ** Objective response rate = partial response + complete response. Abbreviations: CR, complete response; DCR, disease control rate; ORR, objective response rate; PD, progressive disease; PR, partial response; SD, stable disease.

