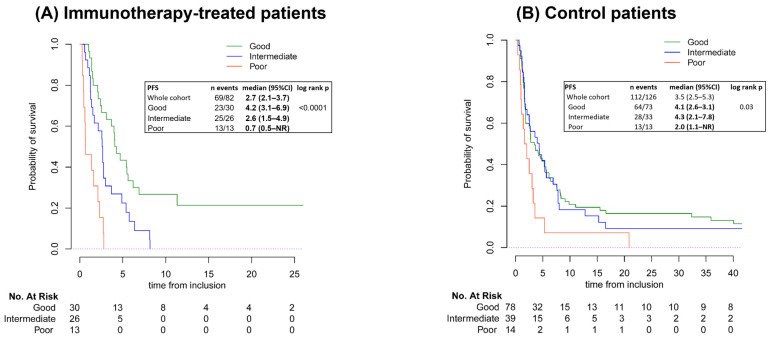
Figure 2.
Kaplan–Meier curves of PFS by LIPI group. Both graphs are mapped according to the probability of survival and time from inclusion to denote number at risk. (A) PFS for the immunotherapy cohort, (B) PFS for the control cohort. Abbreviations: 95%CI, 95% Confidence Interval; NR, not reached; PFS, progression-free survival.

