Figure 7.
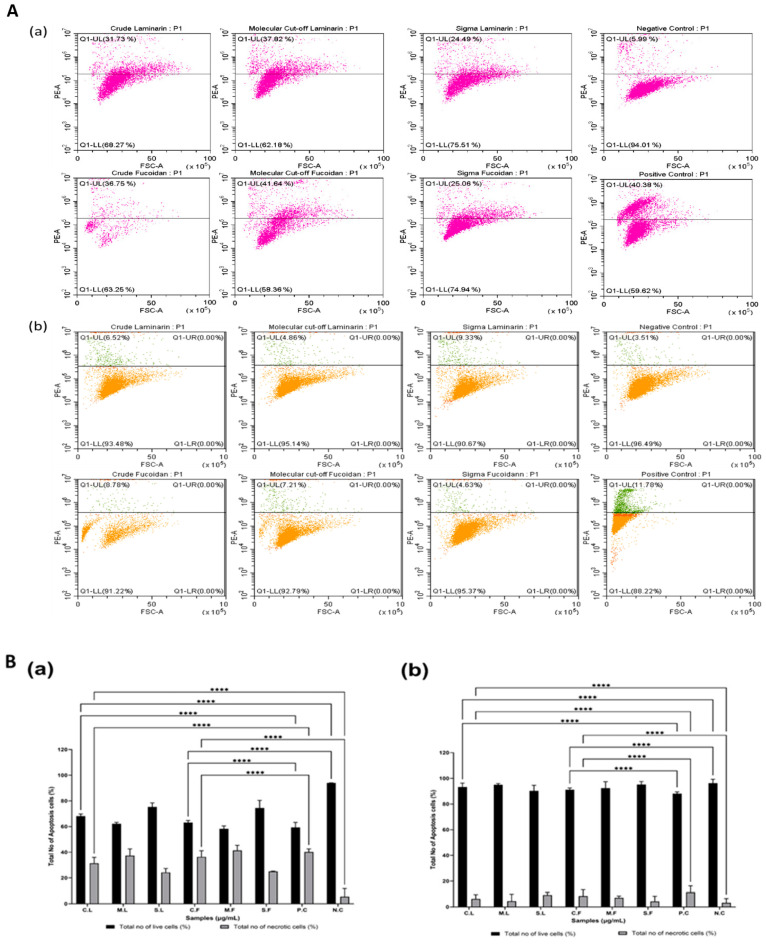
(A) Analysis of flow cytometry data for seaweed samples. (a) U-251MG human glioblastoma multiforme cells and (b) A431 human epidermoid carcinoma cells at 6 days post-treatment incubation. (B) Flow cytometry data of seaweed samples at 6 days post-treatment incubation. (a) A graph representing different samples in U-251MG human glioblastoma multiforme cells and (b) a graph representing different samples in A431 human epidermoid carcinoma cells. The graph shows the total number of apoptotic cells (%), represented as a bar chart, and we analysed the significant differences (**** p < 0.0001 vs. P.C. and N.C.). Seaweed samples used for study were crude laminarin (C.L.), MWCO 10 kDa laminarin fraction (M.L.), Sigma laminarin standard (S.L.), crude fucoidan (C.F.), MWCO 10 kDa fucoidan fraction (M.F.), and Sigma fucoidan standard (S.F.); positive and negative controls denoted as P.C. and N.C., respectively.

