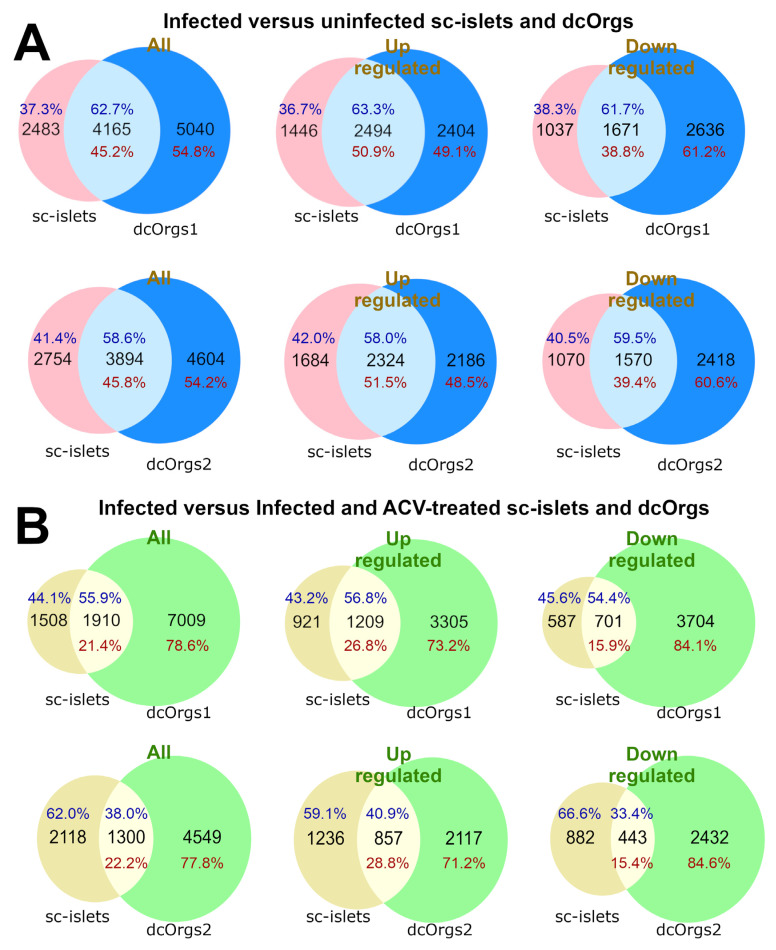
Figure 2.
Comparisons of DEGs from HSV-1 infection in sc-islets versus two dcOrg replicates (dcOrgs1 and dcOrgs2). (A) Venn diagrams showing the numbers of HSV-1-infected versus uninfected DEGs that are common between sc-islets and dcOrgs1, as well as sc-islets and dcOrgs2. The percentages in blue text are calculated using the sc-islet DEGs, and the percentages in red text are calculated using the dcOrg DEGs. (B) Venn diagrams showing the numbers of HSV-1-infected versus HSV-1-infected and ACV-treated DEGs that are in common between sc-islets and dcOrgs1, as well as sc-islets and dcOrgs2. The percentages in blue text are calculated using the sc-islet DEGs, and the percentages in red text are calculated using the dcOrg DEGs.

