Figure 4.
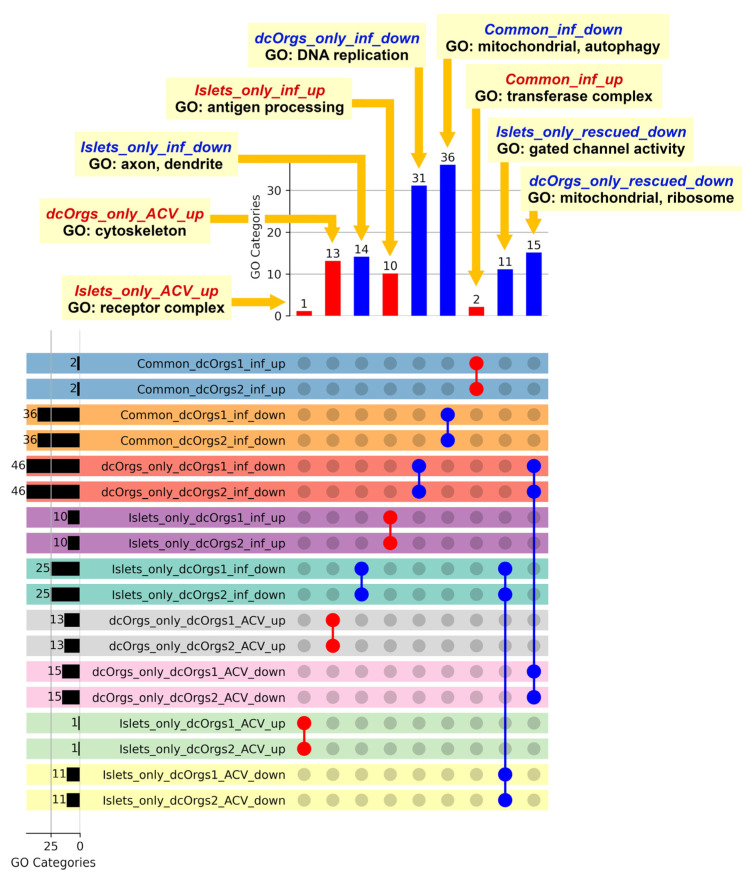
Shared GO categories across HSV-1-infected, or HSV-1-infected and ACV-treated sc-islets and dcOrgs. The bar graph on the left shows the total number of GO categories for each comparison. The bar graph at the top shows the numbers of shared GO categories across the DEG results, and the UpSet plot shows the DEG results that share these distinct GO categories. Shaded circles indicate the DEG result that shares the GO category; the red shaded circles highlight the up-regulated DEG results with the GO categories that were mentioned in the main text; the blue shaded circles highlight the down-regulated DEG results with the GO categories that were mentioned in the main text. The first four rows in the UpSet plot show the shared GO categories for the up-regulated genes in common due to HSV-1 infection in sc-islets and both sets of dcOrg replicates (Common_dcOrgs1_inf_up and Common_dcOrgs2_inf_up), down-regulated genes in common in HSV-1-infected sc-islets and both dcOrg replicates (Common_dcOrgs1_inf_down and Common_dcOrgs2_inf_down). The next eight rows in the UpSet plot show the shared GO categories for up-regulated or down-regulated genes exclusively in dcOrgs or exclusively in islets. The results for the HSV-1-infected and ACV-treated datasets are shown in the next 12 rows.

