Figure 1.
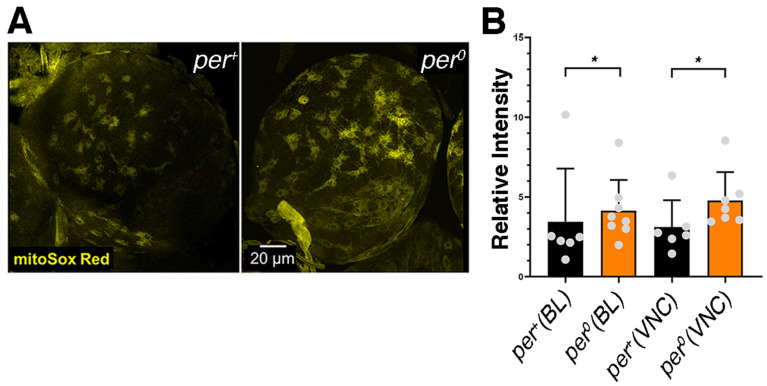
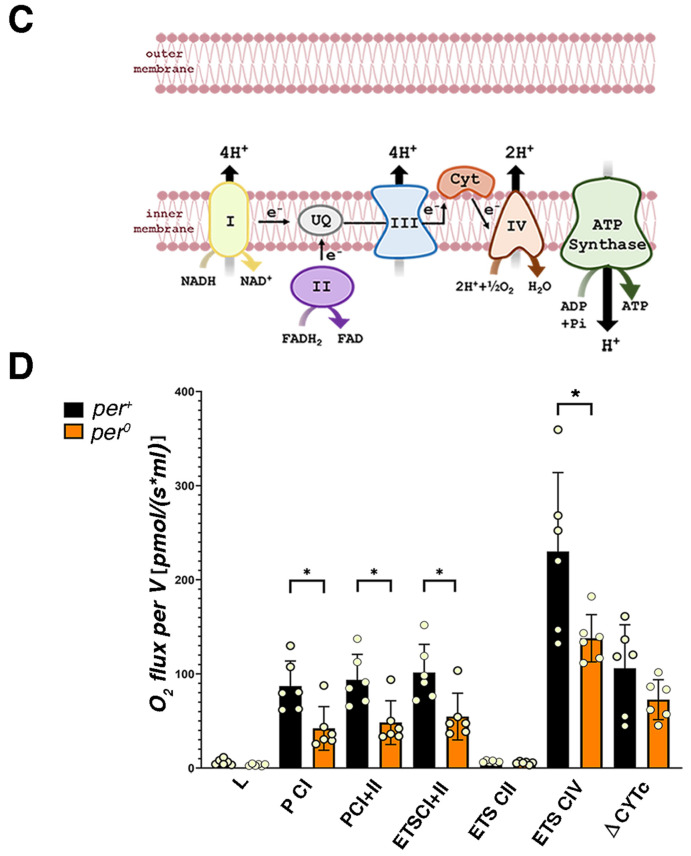
High levels of ROS and mitochondrial respiration defects in per0 mutants. (A) Brain lobes stained with mitoSox Red in per+ and per0 third-instar larvae. Confocal maximum intensity projections. Size bar = 20 μm. ZT = 2. (B) Quantification of mitoSox Red signal in per+ and per0. Brain lobes (Kolmogorov–Smirnov test, * p = 0.042) and ventral cords (Kolmogorov–Smirnov test, * p = 0.015) were compared separately. Points show individual samples. Error bars = SD (standard deviation). ZT = 2. (C) Cartoon of the mitochondrial complexes involved in oxidative phosphorylation (OXPHOS). (D) High-resolution respirometry (oxygen flux per volume [pmol·s−1·mL−1]) in 3–5 day old per+ and per0 flies. OXPHOS capacity related to complex I (P CI; Mann–Whitney, * p = 0.026) and complex I plus II (P CI + II; Mann–Whitney, * p = 0.026) were reduced in per0 compared to per+ controls. Additionally, per0 showed reduced electron transfer capacity through complex I plus II (ETS CI + II; Mann–Whitney, * p = 0.026), and through complex IV (ETS CIV; Mann–Whitney, * p = 0.041) but not complex II alone (ETS CII; Mann–Whitney, p = 0.132). There were no differences in mitochondrial leak (L; Mann–Whitney, p = 0.093) and in mitochondrial integrity (ΔCYTc; Mann–Whitney, p = 0.310) between the two genotypes. Points show individual samples. Error bars = SD. ZT = 1. All samples were males obtained by reciprocal crossing (♀ CS × ♂ per0 and vice versa).


