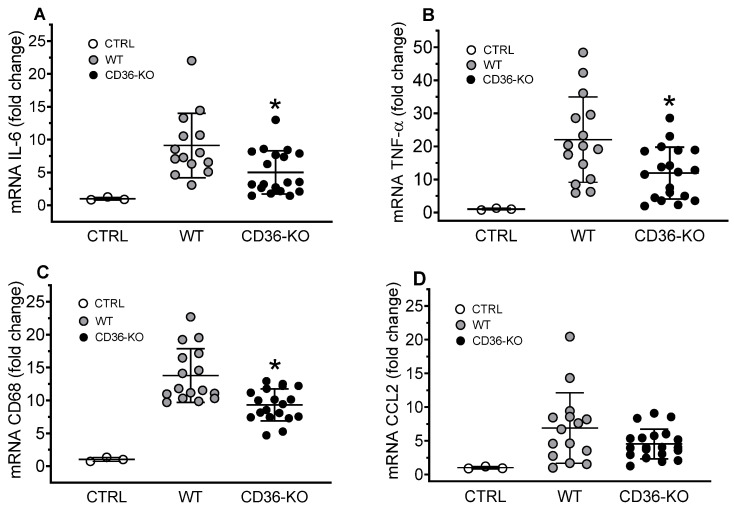
Figure 8.
Hepatic gene expression of inflammatory markers in WT and CD36-knockout mice IP injected with a TCL preparation. Livers were collected for mRNA extraction and qRT-PCR assay as described in Materials and Methods. Expression levels of IL-6 (A), TNF-α (B), CD68 (C), and CCL2 (D) were normalized by GAPDH expression and are presented as the fold change relative to the PBS-treated WT control mice. Values shown are the means ± STD (n = 12–15 for the WT group, n = 20 for the CD36-KO group). * p < 0.05, versus WT TCL-treated mice.

