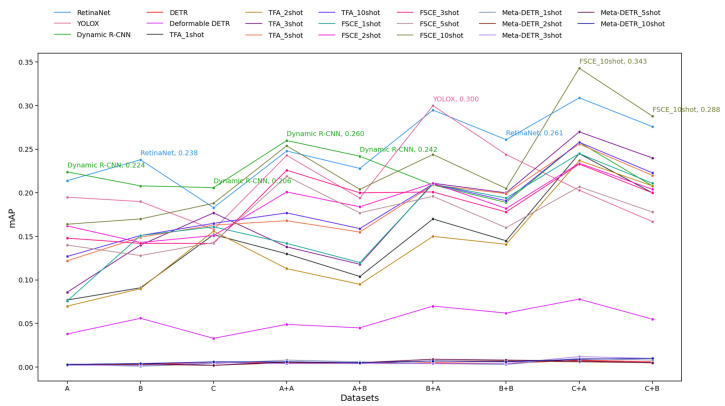
Figure 6.
Mean average precision (mAP) results for Schemes 1 to 4. The y-axis represents mAP values, while the x-axis shows the datasets used for model training. “A” refers to training the object detection model on Dataset A (Schemes 1 and 3), while “A + B” indicates first using the classification model trained on Dataset B and then the object detection model trained on Dataset A (Schemes 2 and 4). The same applies to other labels. For the object detection models, each line is the performance of the indicated model on the test set. For the FSOD models, the five lines are the performance for each few-shot fine-tuning scenario (1-shot, 2-shot, 3-shot, 5-shot, 10-shot). The mAP of the best-performing model is shown for each dataset labeled on the x-axis.

