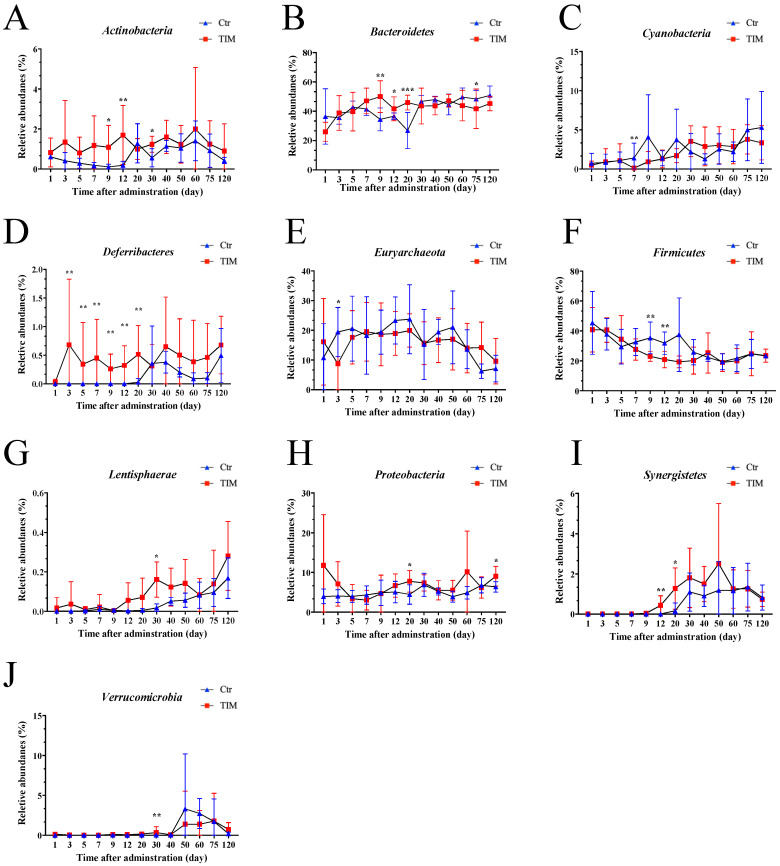
Figure 5.
Relative abundances of the significantly changed gut microbiota at the phylum level after the withdrawal period. (A) Actinobacteria in the control and the TIM-treated group. (B) Bacteroidetes in the control and TIM-treated groups. (C) Cyanobacteria in the control and TIM-treated groups. (D) Deferibacteres in the control and TIM-treated groups. (E) Euryarchaeota in the control and TIM-treated groups (F) Firmicutes in the control and TIM-treated groups. (G) Lentisphaerae in the control and TIM-treated groups. (H) Proteobacteria in the control and TIM-treated groups. (I) Synergistes in the control and TIM-treated groups. (J) Verrucomicrobia in the control and TIM-treated groups. Statistical significance is indicated as * p < 0.05, ** p < 0.01, *** p < 0.001, assessed using the Wilcoxon rank-sum test. Ctr, controls (n ≥ 4); TIM, TIM-treated Silkie chickens (n ≥ 6).

