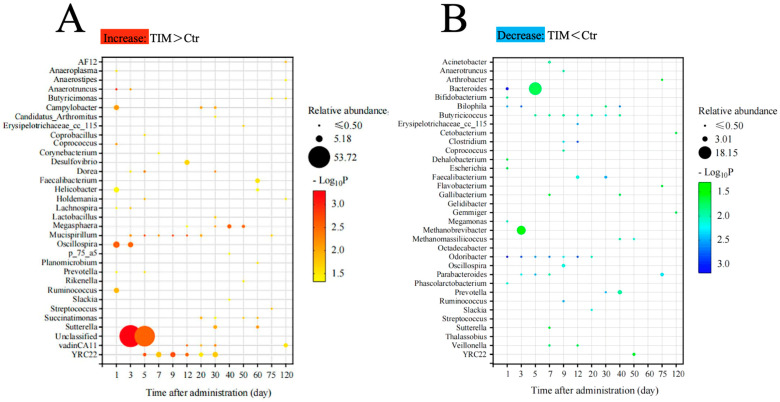
Figure 6.
Changes in the gut microbiota relative abundances were observed in response to TIM treatment. (A) Gut microbiota that increased in relative abundance in the TIM-treated group. (B) Gut microbiota with decreased relative abundance in the TIM-treated group. Analyzed using the Wilcoxon rank-sum test. Ctr, controls (n ≥ 4); TIM, TIM-treated Silkie chickens (n ≥ 6).

