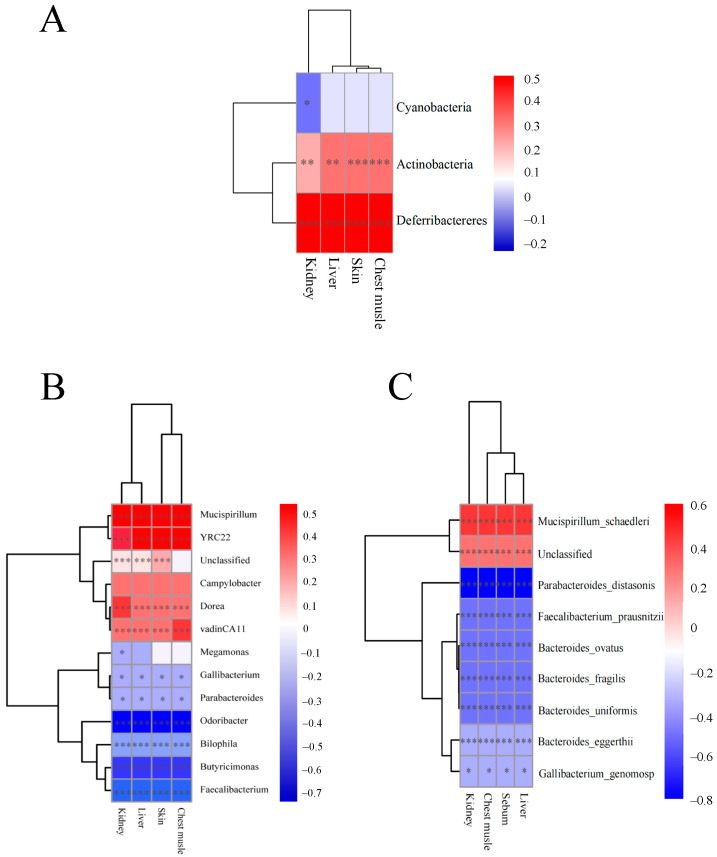
Figure 7.
Significant correlations were found between gut microbiota and residual TIM in various tissues. (A) Pearson’s correlation at phylum level. (B) Pearson’s correlation at genus level. (C) Pearson’s correlation at specie level. Statistical significance indicated as * p < 0.05, ** p < 0.01, *** p < 0.001, assessed using Pearson’s test. Pearson’s correlation coefficients (R) displayed as side values with corresponding p-value * for indicating Pearson’s linear correlation (P). Ctr, controls (n ≥ 4); TIM, TIM-treated Silkie chickens (n ≥ 6).

