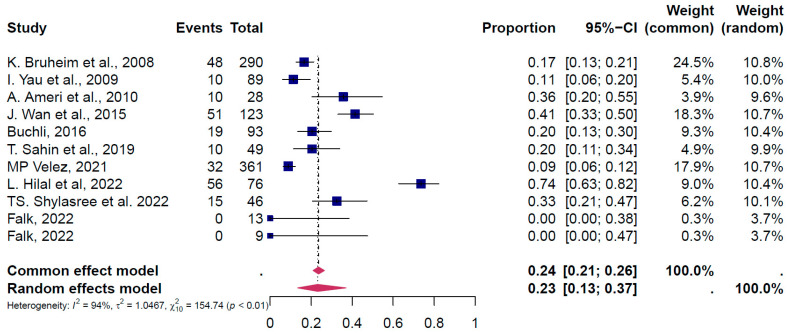
Figure 2.
The pooled overall prevalence of general gonadotoxicity [27,30,32,33,34,35,37,38,40,43]. A forest plot of the proportions and 95% confidence intervals (CIs) in studies that evaluated the prevalence of clinically relevant gonadotoxicity in women and men following gonadotoxic therapy for CRC, where 0 means 0% clinically relevant gonadotoxicity and 1 = 100% clinically relevant gonadotoxicity. The blue square for each study indicates the proportion, the size of the box indicates the weight of the study, and the horizontal line indicates the 95% CI. The data in bold and the pink diamond represent the pooled prevalence for post-treatment clinically relevant gonadotoxicity and 95% CI. Overall estimates are shown in the fixed- and random-effects models.

