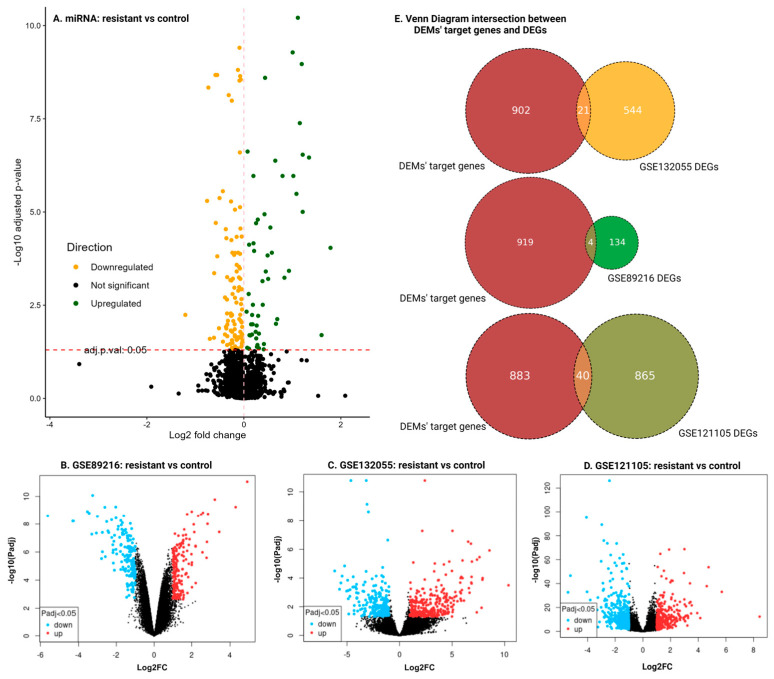
Figure 2.
Summary of DEMs and DEGs across multiple datasets. (A) Volcano plot for miRNA meta-datasets, the result of the meta-analysis. Yellow points indicate downregulated miRNAs, and green points indicate upregulated miRNAs, with an adjusted p-value < 0.05 as the significance threshold. (B–D) Volcano plots for mRNA datasets GSE89216 (B), GSE132055 (C), and GSE121105 (D), showing differential expression analysis. Blue points represent downregulated genes, and red points represent upregulated genes. In all volcano plots, the Log2-fold differences are plotted on the horizontal axis, and the −Log10pvalue differences are plotted on the vertical axis. The significance criteria for identifying DEGs are an adjusted p-value < 0.05 and an absolute Log2-fold change|Log2FC| > 1. (E) Venn diagram depicting the intersection between DEM target genes and DEGs, highlighting genes associated with HER2-targeted drug resistance.

