Figure 6.
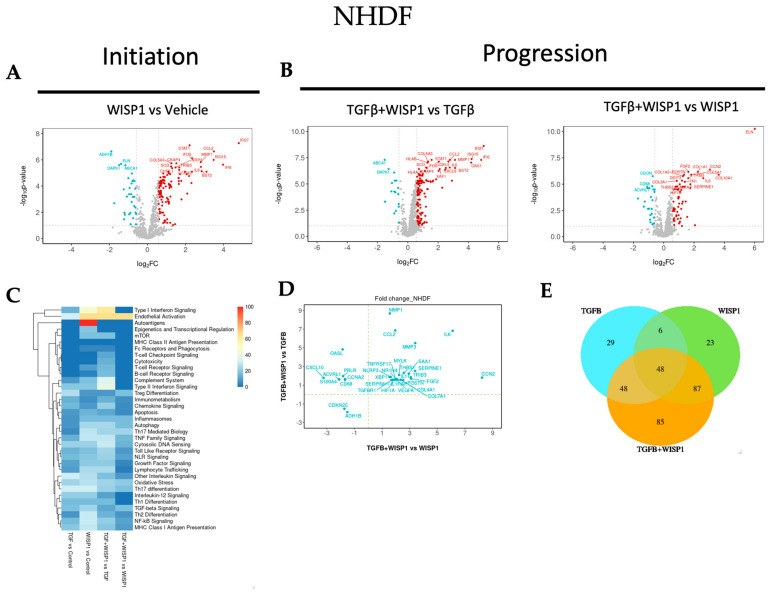
WISP1 fibrotic gene signature in dermal fibroblasts. The volcano plot illustrates fibroblast genes upregulated (red) and downregulated (blue) upon stimulation with either (A) WISP1 alone or (B) in conjugation with TGFβ as compared to vehicle control (PBS) in NHDF (n = 3). The plots representing statistically significant gene with |FC| > 1.5 and adj. p-value < 0.1 are plotted with the x-axis representing log2 fold change (FC) versus the y-axis −log10 p-value. (C) The heatmap represents pathways significantly associated with the corresponding treatment condition as percent of genes influenced and the list of genes used in the pathway analysis is highlighted in Table S8. (D) Scatterplot showing log2 fold change for the differentially expressed genes when comparing WISP1 + TGFβ treatment with WISP1 (x-axis) versus TGFβ (y-axis). (E) Venn diagram representing unique and overlapping set of genes between the WISP1, TGFβ, and WISP1 + TGFβ treatment paradigms. A comprehensive lists of genes is provided in the Supplementary Materials.

