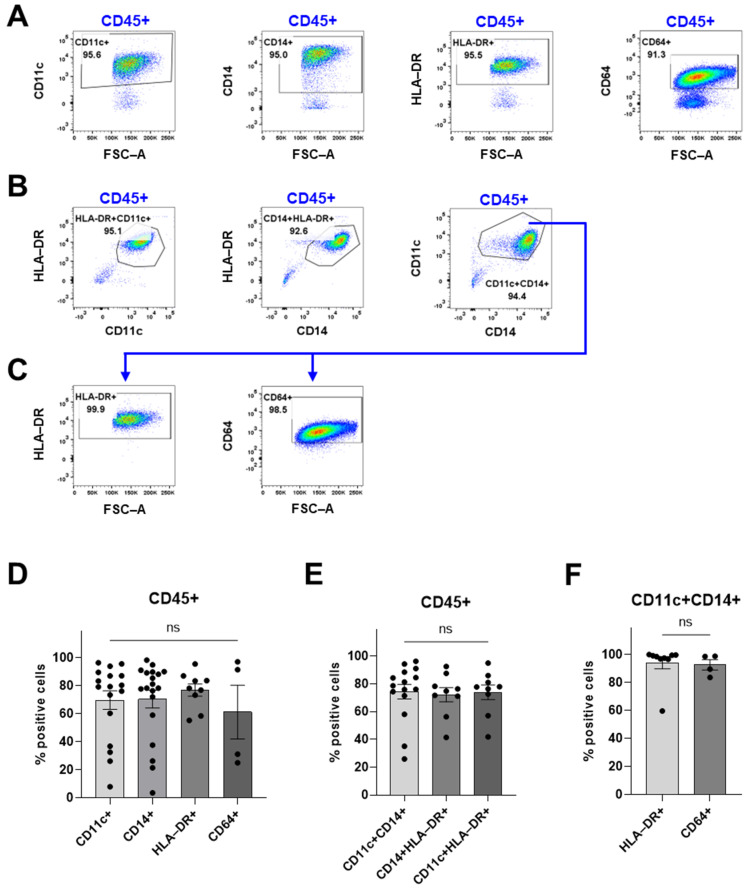
Figure 3.
An overview of the myeloid compartment of the digested meningioma tissue using flow cytometry. Debris, doublets, and dead cells were excluded before the CD45+ gate (as shown in Figure 2A). (A) The gating strategy for Figure 3D. (B) The gating strategy for Figure 3E. (C) The gating strategy for Figure 3F. (D) The proportion of CD11c+ cells, CD14+ cells, and CD64+ cells of viable CD45+ immune cells. (E) Proportions of CD11c+CD14+, CD14+HLA-DR+, and CD11c+HLA-DR+ cells. (F) HLA-DR+ and CD64+ cells of CD11c+CD14+ cells. Data is presented as mean with SEM ((D) with n = 17 from 10 experiments for CD11c, n = 19 from 12 experiments for CD14, n = 9 from 6 experiments for HLA-DR, and n = 4 from 2 experiments for CD64; (E) with n = 15 from 9 experiments for CD11c+CD14+, n = 9 from 6 experiments for CD14+HLA-DR+, and n = 9 from 6 experiments; and (F) with n = 9 from 6 experiments for HLA-DR and n = 4 from 2 experiments. Either a t-test or one-way ANOVA with post-hoc testing was used for statistical comparisons. Statistical significances are presented as ns = non-significant.

