Figure 3.
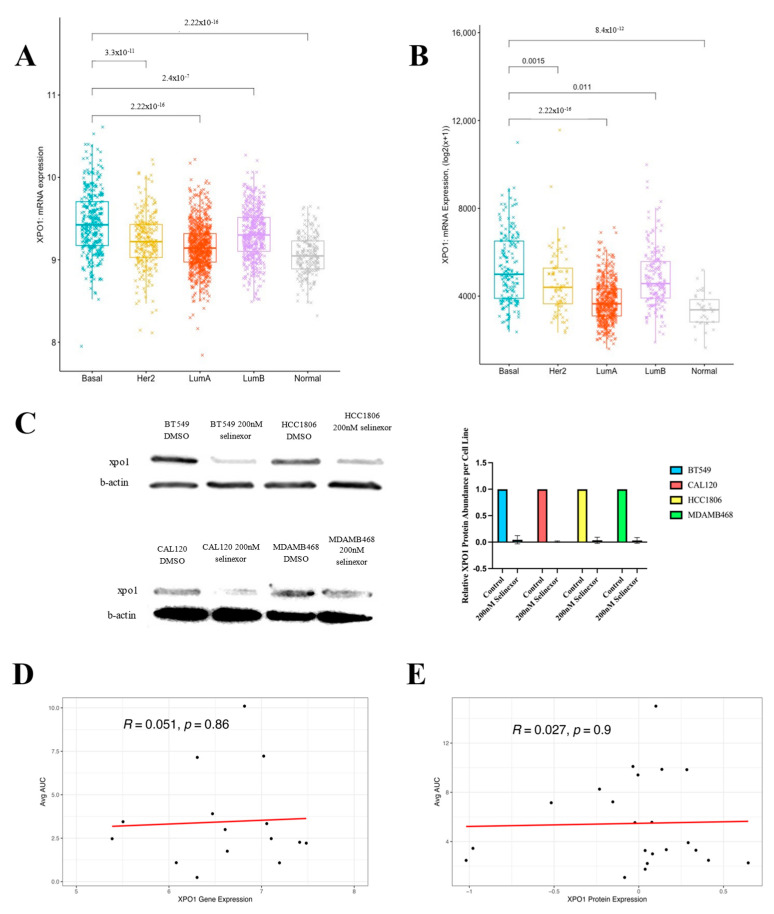
XPO1 expression alone does not explain TNBC sensitivity to selinexor. (A) mRNA expression levels of XPO1 obtained by microarray in patients from the METABRIC dataset categorized by breast cancer subtype. Student t-test p-value significance between basal and other TNBC subtypes are displayed in brackets above the subtypes. (B) mRNA expression levels of XPO1 obtained by RNAseq, RSEM batch normalized, in patients from the TCGA breast cancer dataset, categorized by breast cancer subtype. Again, the Student t-test p-value significance between basal and other TNBC subtypes are displayed in brackets above the subtypes. (C) The XPO1 protein expression following 24 h treatment with 200 nM selinexor or DMSO control for 4 TNBC cell lines: BT-549, HCC-1806, CAL-120 and MDA-MB-468. Protein expression was quantified from 3 biological replicates per cell line and is displayed in the bar graph to the right. (D) XPO1 mRNA level gene expression and leptomycin B sensitivity (presented as the area under the drug treatment response curve (AUC) correlation in a collection of CCLE breast cancer cell lines. (E) The XPO1 protein level expression and leptomycin B sensitivity (presented as the area under the drug treatment response curve (AUC) correlation in a collection of CCLE breast cancer cell lines.

