Figure 5.
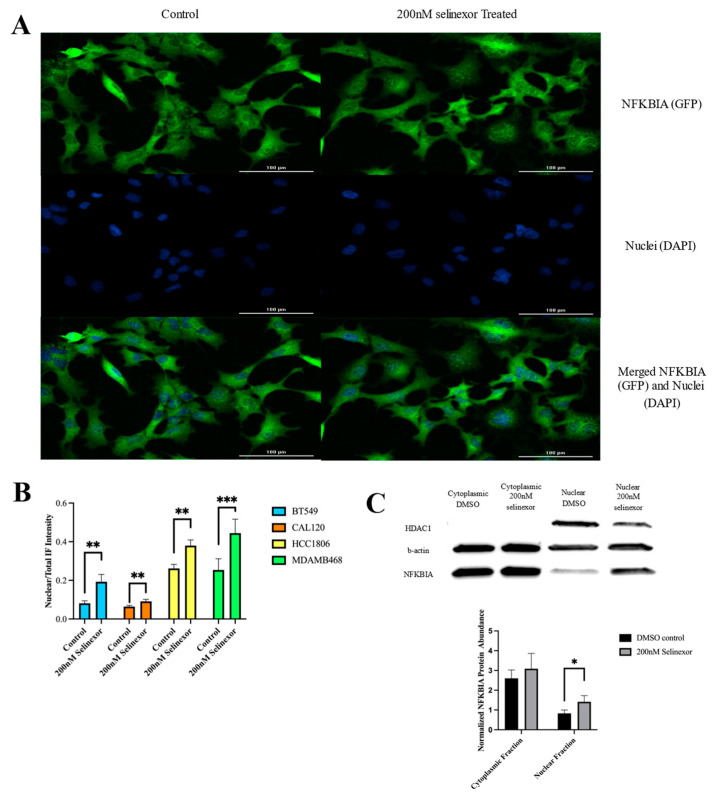
Immunohistochemistry staining and the Western blot of NFKBIA shows nuclear retention following selinexor treatment in 4 TNBC cell lines. (A) Immunofluorescence (IF) of BT-549 cell line using BioSpa Cytation shows increased NFKBIA (GFP-labeled) within the nucleus following selinexor treatment. Columns represent the treatment condition and horizontal images were taken from the same section and overlayed. IF images of CAL-120, HCC-1806 and MDA-MB-468 can be found in Supplemental Figure S4. Nuclear staining was obtained using Hoechst by the DAPI channel. (B) The quantification of the IF signal across the four cell lines for NFKBIA abundance within the nucleus. Nuclear to total localization was identified using the overlap of the GFP signal and Hoechst nuclei staining and then normalized to the total GFP signal per cell. All four cell lines displayed significantly higher levels of nuclear NFKBIA compared to the control (Student t-test, p-values: <0.01). (C) Western blot of cytoplasmic and nuclear protein fractionization of BT-549 post-24 h treatment with 200 nM selinexor or DMSO control. B-actin was used as a cytoplasmic loading control while HDAC1 was used as a nuclear control. The NFKBIA signal was normalized to loading control and p-value significance across 3 biological replicates was significant by Student t-test at 0.046. Associated normalized protein abundance is also represented in the bar graph directly below the Western blot. An additional Western blot of HCC-1806, analyzed with the same protocol stated previously, can be found in Supplemental Figure S4. The number of * in each bar graph indicate p-value significance with * indicating <0.05, ** <0.01 and *** <0.001.

