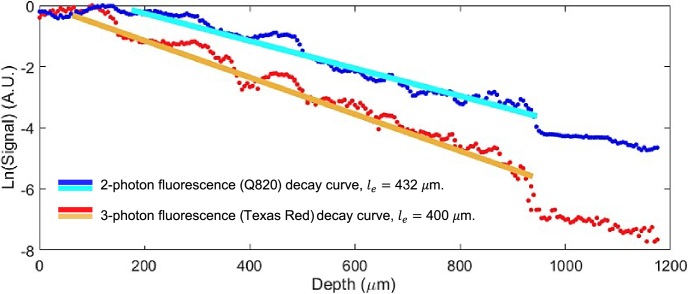
Fig. 4.
2-photon and 3-photon fluorescence signal decay curve plotted on a semi-log scale for calculating the effective attenuation lengths in the neocortex. The straight lines are linear fitting results for calculating the effective attenuation length . The irregular bumpy structure seen in both the 2P and 3P plots is likely due to the inhomogeneity of vasculature, specifically the presence of large blood vessels that cross through different cortical depths. This variability in vasculature can create uneven signal intensities at various depths, leading to the observed irregularities in the plots.

