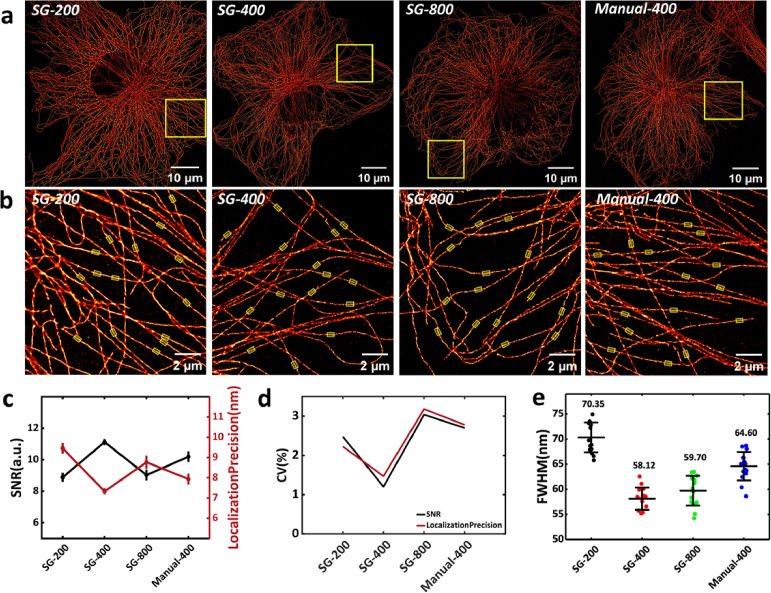
Fig. 3.
Results of microtubule IF staining in COS-7 cells using the SG protocol under four conditions. (a) Overall super-resolution image of single-cell microtubule under four different conditions. (b) Enlarged view of the yellow boxed area in (a), with the yellow transparent regions highlighting the microtubules used for FWHM calculation. (c) Mean line graphs of showing the imaging localization precision and SNR for five randomly selected regions under four conditions. (d) Line graphs showing the Coefficient of Variation (CV) of localization precision and SNR for five randomly selected regions under four conditions. (e)Statistical distribution of the FWHM of microtubules (n = 15). (All error bars are the standard deviations.)

