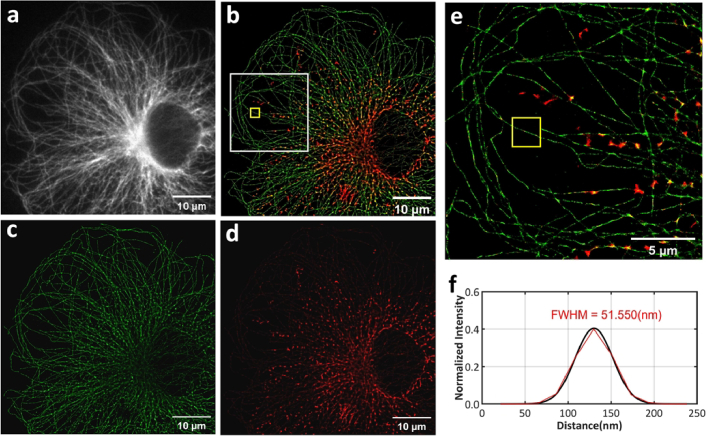
Fig. 5.
Multi-color super-resolution imaging results. (a) Wide-field fluorescence image of microtubule and mitochondria after demosaicking processing. (b) Multi-color super-resolution result of microtubule and mitochondria. (c) Algorithmically separated microtubule channel image. (d) Algorithmically separated mitochondrial channel image. (e) Enlarged view of the white boxed area in (b). (f) FWHM value of microtubule at the yellow boxed area.

