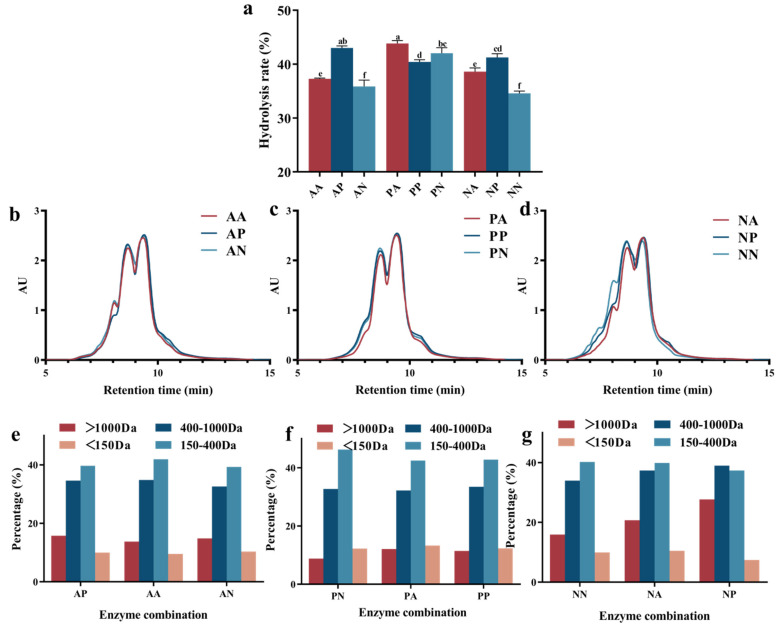
Figure 1.
The hydrolysis rate (a), size exclusion chromatogram (b–d), and the calculated certain-sized collagen peptide percentage (e–g), after dual-enzyme hydrolysis. The figure b and e represented the sample treated by AA, AP, and AN. The figure c and f represented the sample treated by PA, PP, and PN. The figure d and g represented the sample treated by NN, NA, and NP.

