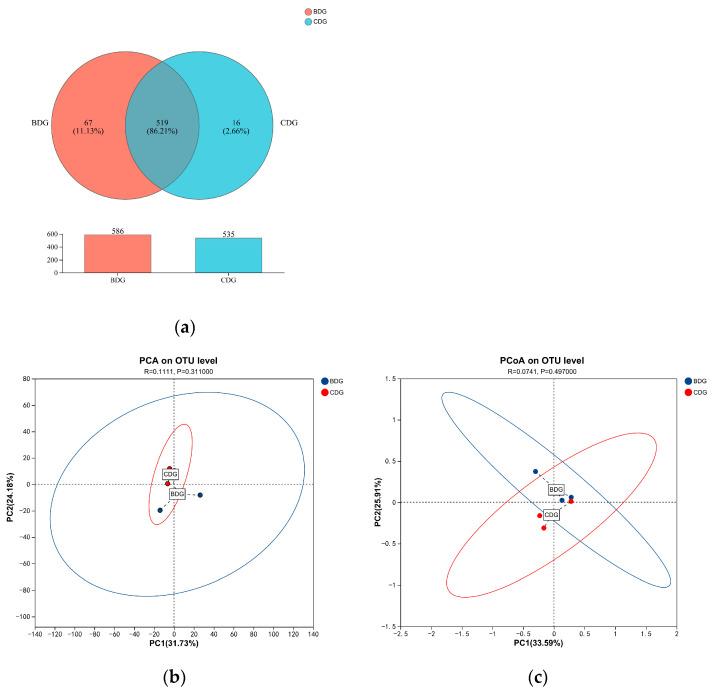
Figure 3.
(a) Comparison of operational taxonomic units (OTUs) among groups; (b) PCA plot based on Bray–Curtis distance, illustrating the separation of bacterial communities between the CDG and BDG groups. Each dot represents a sample, with red indicating the BDG group and blue the CDG group. The percentage of variance explained by each principal component is indicated on the axes. The results show a p value of 0.3110, indicating no significant difference; (c) PCoA plot derived from the same distance matrix, visualizing the similarity and dissimilarity in microbial community composition. Ellipses represent the 95% confidence intervals for each group. Statistical significance was determined by ANOSIM, with a p value of 0.4970, also indicating no significant difference. p > 0.05 indicates that the difference between groups is not significant.

