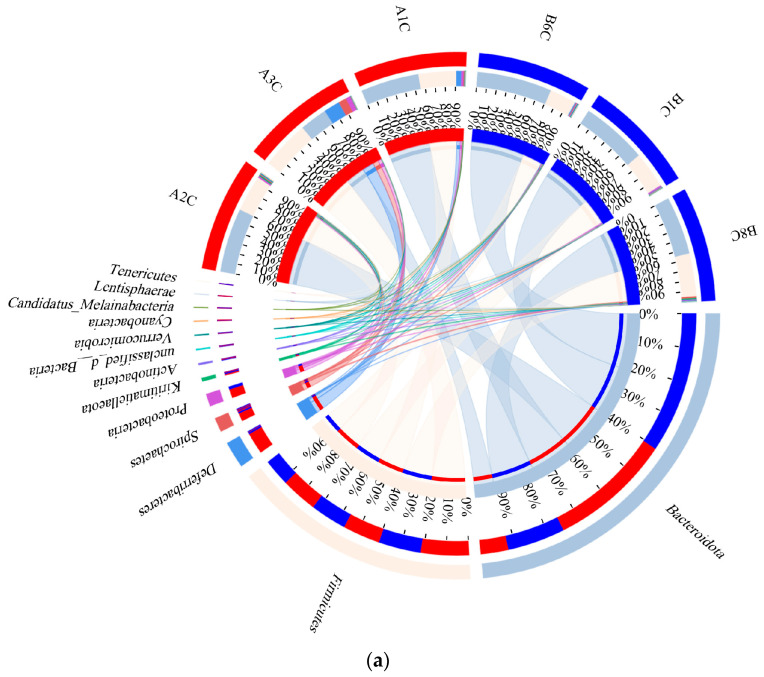
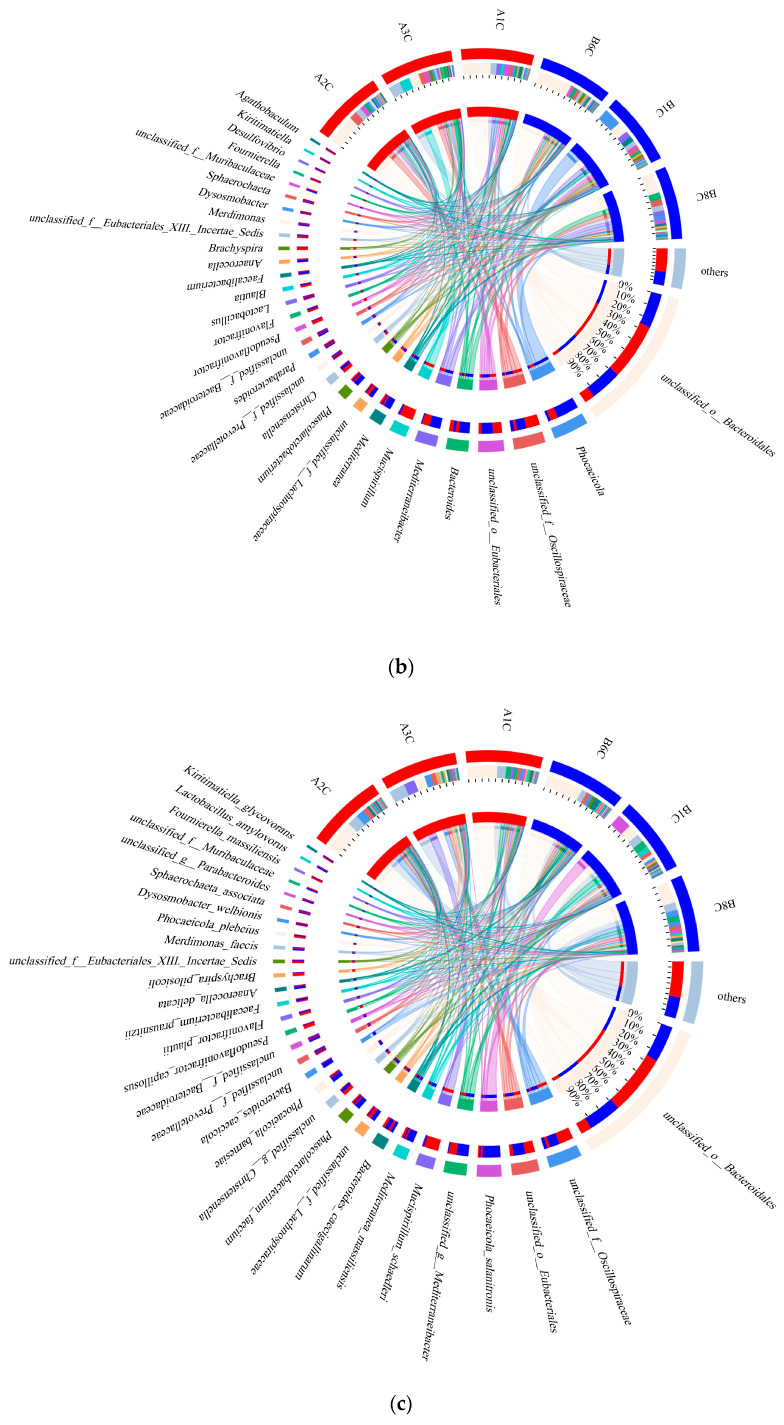
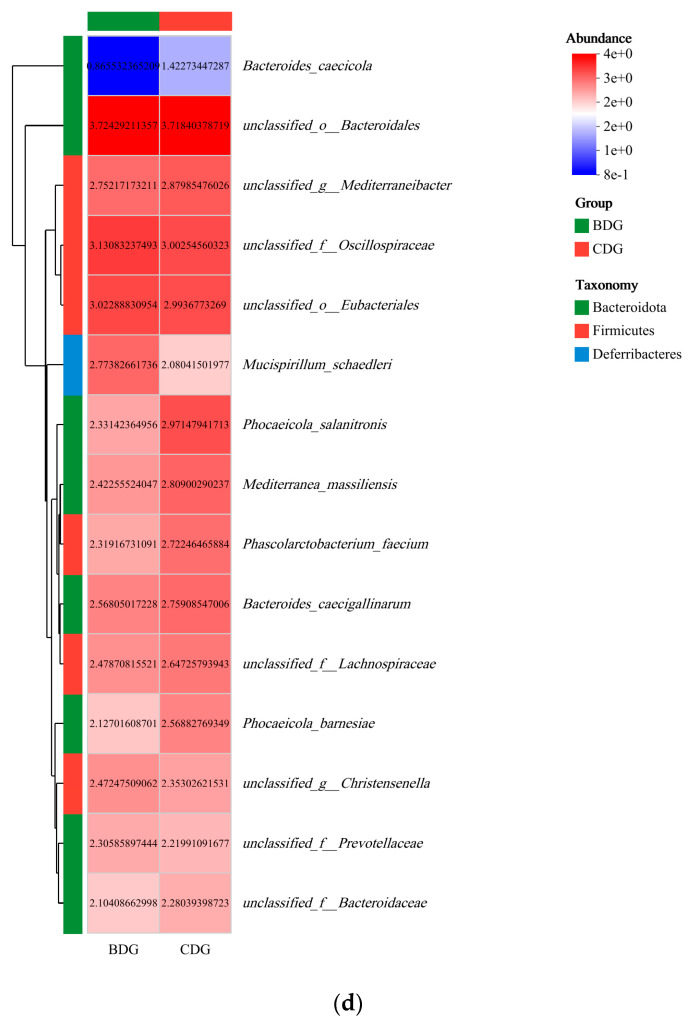
Figure 4.
Comparative analysis of microbial community composition between the BD and CD groups: (a) phylum level, highlighting the variations in species composition; (b) genus level, detailing the differences in species composition; (c) species level, examining the nuances in species composition; (d) an intuitive visualization of the compositional and abundance profiles of the BDG and CDG bacterial communities, along with their distribution at the species level. Samples A1C, A2C, and A3C represent the CDG group, whereas B1C, B6C, and B8C represent the BDG group.


