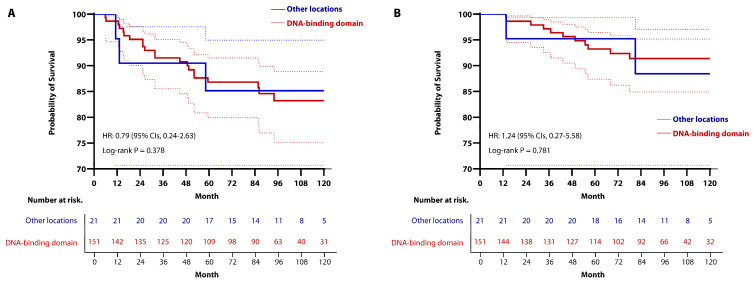
Figure 5.
Kaplan-Meier curve for (A) RFS and (B) OS in the TP53-mutated group, stratified by mutation locations. To compare oncologic outcomes, we used stratified log-rank test and Cox regression analysis. (A) There was no significant difference between the two groups (the 5-year RFS rates: 86.8% (95% CIs 79.9–91.5) in the DBD group vs. 85.2% (95% CIs, 60.6–95.0) in the other locations group; the 10-year RFS rates: 83.2% (95% CIs, 75.2–88.9) in the DBD group vs. 85.2% (95% CIs, 60.6–95.0) in the other locations group) (HR, 0.79; 95% CIs, 0.24–2.63; p = 0.378). (B) There was also no significant difference between the two groups (the 5-year OS rates: 93.2% (95% CIs, 87.4–96.4) in the DBD group vs. 95.2% (95% CIs, 70.7–99.3) in the other locations group; the 10-year OS rates: 91.4% (95% CIs, 84.9–95.2) in the DBD group vs. 88.4% (95% CIs, 60.3–97.1) in the other locations group) (HR, 1.24; 95% CIs, 0.27–5.58; p = 0.781).

