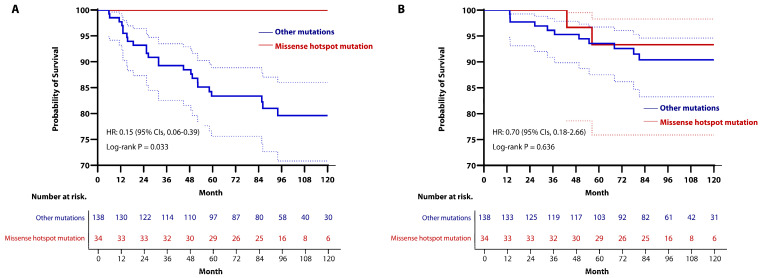
Figure 6.
Kaplan-Meier curve for (A) RFS and (B) OS in patients with TP53 mutation, stratified by the presence or absence of missense hotspot mutations. (A) By utilizing stratified log-rank test and Cox regression analysis, patients with missense hotspot mutations had a longer RFS period (the 5-year RFS rates: 100% in the missense hotspot mutations group vs. 83.4% (95% CIs, 75.6–88.8) in the other mutations group; the 10-year RFS rates: 100% in the missense hotspot mutations group vs. 79.6% (95% CIs, 70.8–86.0) in the other mutations group (HR, 0.15; 95% CIs, 0.06–0.39; p = 0.028). (B) Stratified log-rank test and Cox regression analysis showed that there was no significant difference between the two groups (the 5-year OS rates: 93.3% (95% CIs, 75.9–98.3) in the missense hotspot mutations group vs. 93.6% (95% CIs, 87.6–96.7) in the other mutations group; the 10-year OS rates; 93.3% (95% CIs, 75.9–98.3) in the missense hotspot mutations group vs. 90.4% (95% CIs, 83.3–94.6) in the other mutations group (HR, 0.70; 95% CIs, 0.18–2.66; p = 0.636).

