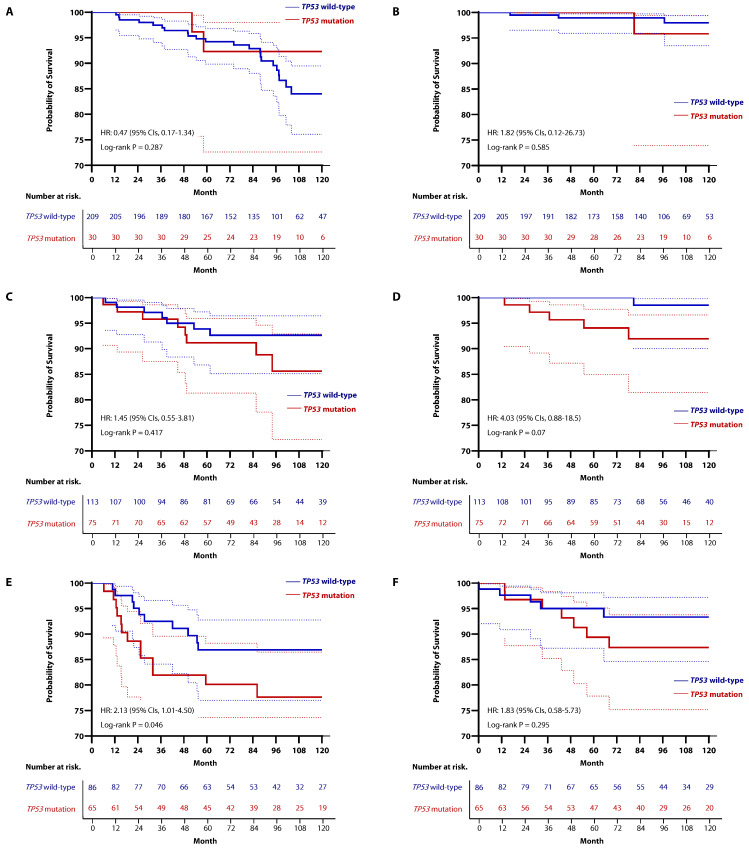
Figure 7.
Kaplan-Meier curve for RFS and OS according to TP53 mutation status in each subtype. In HR+/HER2-subtype, there was no difference in (A) RFS (HR, 0.47; 95% CIs, 0.17–1.34; p = 0.287) or (B) OS (HR, 1.82; 95% CIs; 0.12–26.73; p = 0.585) between TP53-muated group and TP53 wild-type group. Similarly, in the HER2-positive subtype, no differences were observed in (C) RFS (HR, 1.45; 95% CIs; 0.55–3.81; p = 0.417) or (D) OS (HR, 4.03; 95% CIs; 0.88–18.5; p = 0.07) based on TP53 mutation status. In the TNBC group, (E) TP53-mutated tumors showed worse RFS compared to the TP53 wild-type group (HR, 2.13; 95% CIs; 1.01–4.50; p = 0.046). However, (F) although there was a trend toward worse OS in TP53-mutated tumors, it was not statistically significant (HR, 1.83; 95% CIs, 0.58–5.73; p = 0.295).

