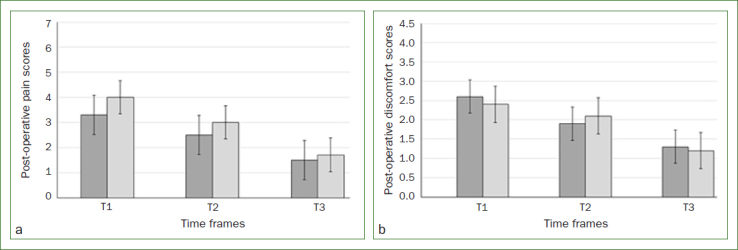
Fig 2.

a. Mean numerical rating scale scores in the test (dark grey bars) and control groups (light grey bars) after 24 h (T1), 48 h (T2) and 72 h (T3); b. Mean verbal rating scores in the test (dark grey bars) and control groups (light grey bars) after 24 h (T1), 48 h (T2) and 72 h (T3).
