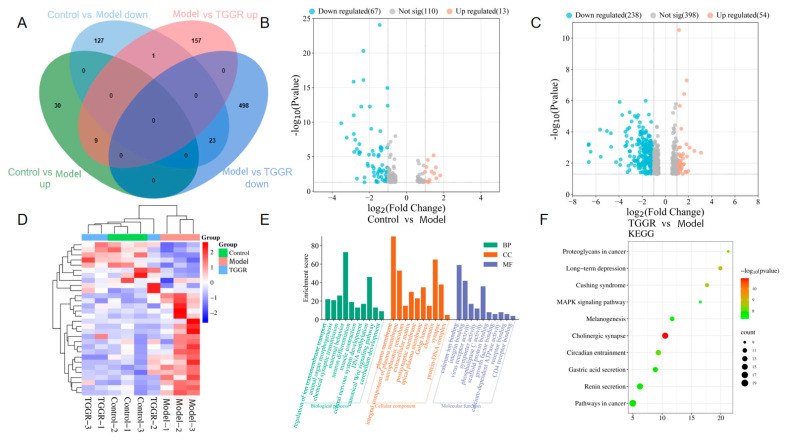
Figure 3.
(A) DEGs crossover results in the control group, CUMS group, and TGGR group. (B,C) DEG volcanic distribution map. Blue dots indicate downregulated mRNA; red dots indicate upregulated mRNA. (D) Heat map analysis of low- and high-expression DEG. (E) GO enrichment analysis was performed on DEGs’ cellular components, biological processes, and molecular functions. The first 10 items are shown in the figure. (F) The top 10 pathways of DEGs after performing KEGG enrichment.

