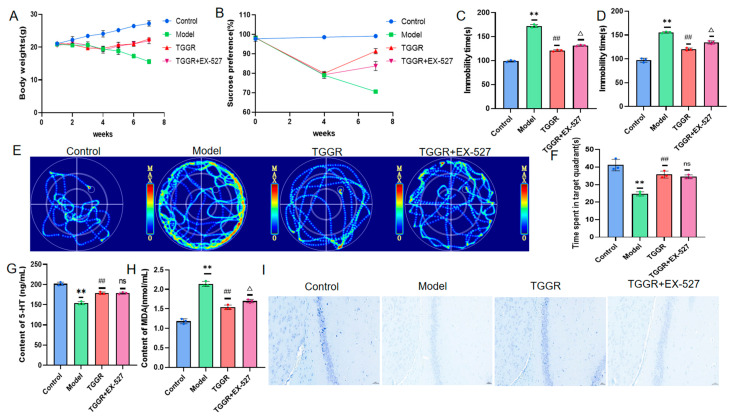
Figure 5.
(A) Changes in body weight of mice. (B) Changes in sucrose preference of mice. (C,D) Effects of TGGR administration on resting time of TST and FST mice. (E) Heat maps of MWM mouse activity. (F) Residence time of mice in the MWM target quadrant. (G,H) ELISA-detected serum 5-HT and MDA levels. (I) Apoptosis of hippocampal neurons in each group (Nissl staining). ** p < 0.01 was significantly different from the control group, ## p < 0.01 was significantly different from model group, △ p < 0.05 was significantly different from TGGR pair, ns > 0.05 was not significantly different.

