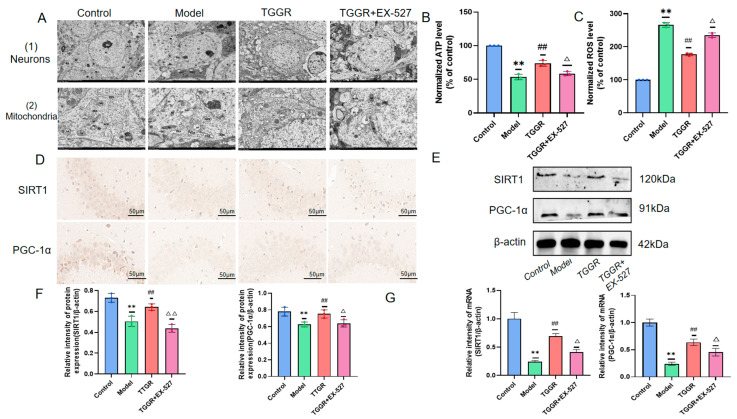
Figure 6.
(A) Ultrastructure of hippocampal neurons and mitochondria of mice in each group. (B) ATP content in mouse hippocampus. (C) ROS levels in mouse brain tissue. (D) Expression of SIRT1 and PGC-1α in mouse hippocampus (immunohistochemical staining). (E) Western blot analysis of SIRT1 and PGC-1α in the hippocampus of mice in each group. (F) Protein expression normalized to β-actin for quantitative analysis, and its value expressed as an average. (G) SIRT1 and PGC-1α mRNA levels detected by RT-qPCR. Data are normalized to β-actin. Values are expressed as average ± SD. ** p < 0.01 was significantly different from the control group, ## p < 0.01 was substantially different from model group, and △ p < 0.05 and △△ p < 0.01 were substantially different from TGGR group.

