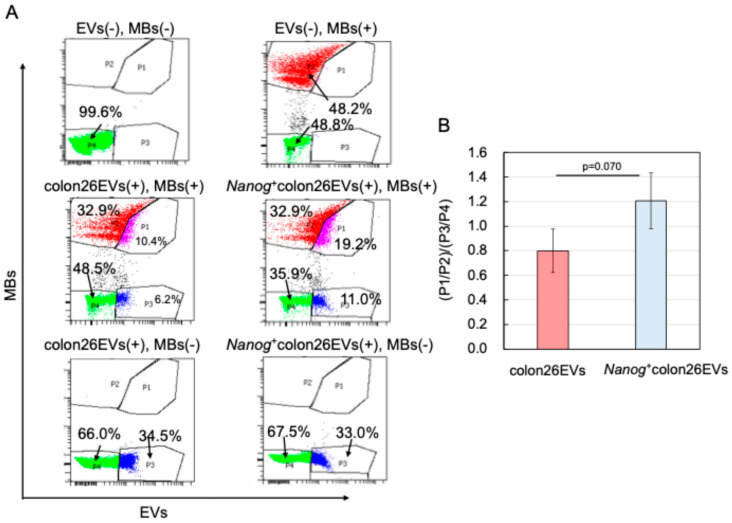
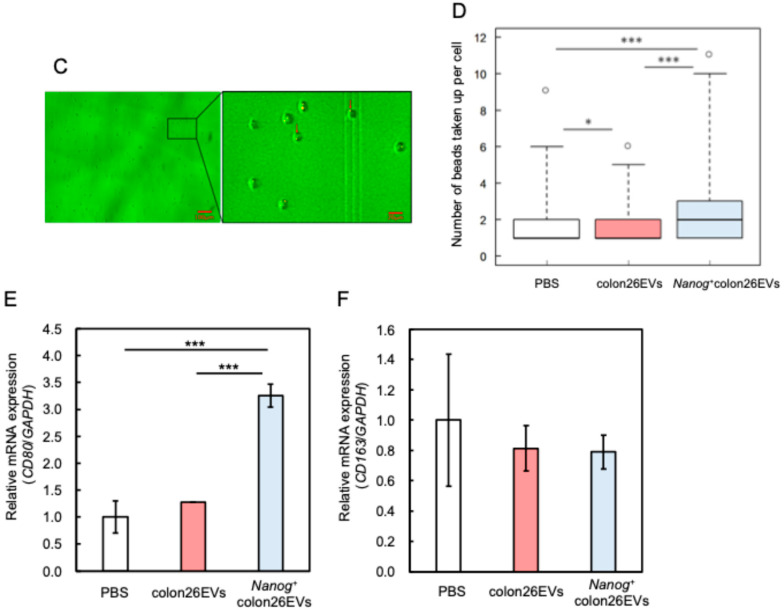
Figure 6.
Effects of EVs on phagocytic activity of J774.1 cells. (A) Flow cytograms of J774.1 cells containing PKH26-EVs and/or FITC-MBs. PKH26, Ex: 551 nm, Em: 567 nm; FITC, Ex: 498 nm, Em: 517 nm. Plot colors: violet in P1, red in P2, blue in P3, green in P4. (B) Phagocytic activity, mean ± SD for n = 3. (C) Uptake of MBs by J774.1 single cells analyzed by fluorescent microscopy. Red arrows indicate MBs. (D) Number of MBs taken up per cell. °: outliers. PBS: n = 377, mean = 1.81, median = 1. colon26EVs: n = 367, mean = 1.65, median = 1. Nanog+colon26EVs: n = 420, mean = 2.19, median = 2. *: p < 0.05; ***: p < 0.001. (E) Expression of macrophage marker (CD80) determined by qPCR; mean ± SD for n = 3. ***: p < 0.001. (F) Expression of macrophage marker (CD163) determined by qPCR; mean ± SD for n = 3.


