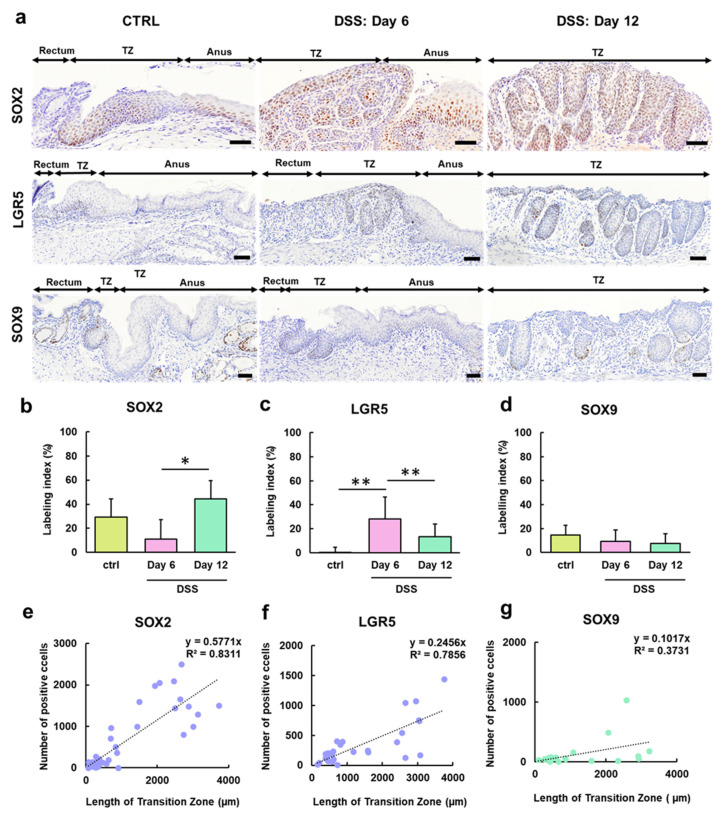
Figure 3.
Immunohistochemical analysis of stem cell markers in the TZ in the control and DSS-treated groups. (a) Representative images of the expression of SOX2, LGR5, and SOX9 in the control mice and mice administered 5% DSS in drinking water for 6 days (Day 6) followed by withdrawal of DSS for 6 days (Day 12). SOX2 is highly expressed in the TZ and anus. Labeling indices of SOX2 (b), LGR5 (c), and SOX9 (d) in the TZ. Scatter plots with correlation coefficient (R2) and linear function (y = ax) between the number of cells showing positive results for SOX2 (e), Lgr5 (f), and SOX9 (g) and the length of the TZ. *, ** Significant differences between each time point or region (p < 0.05 or 0.01, Tukey–Kramer multiple comparison test). DSS, dextran sodium sulfate; LGR5, leucine-rich repeat-containing G-protein-coupled receptor 5; SOX2, sex-determining region on Y-box transcription factor 2; SOX9, sex-determining region on Y-box transcription factor 9; TZ, transitional zone.

