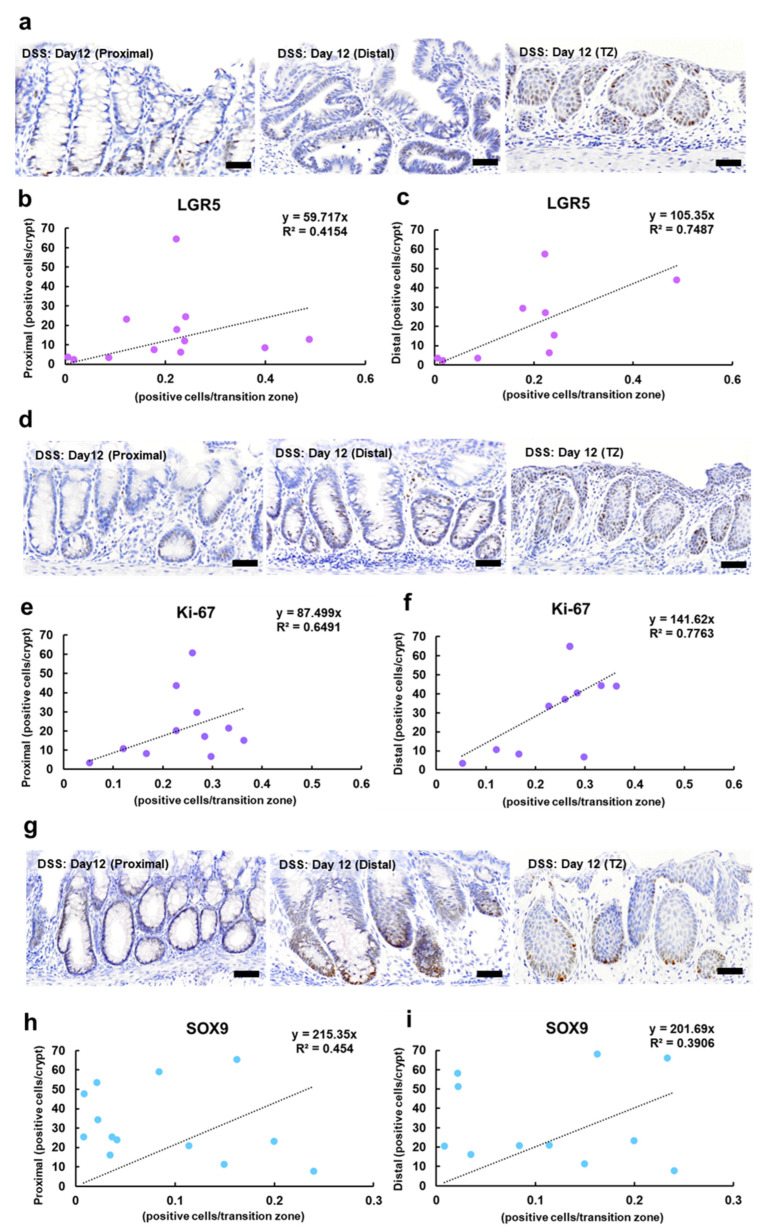
Figure 4.
Immunohistochemical analysis of stem cell and cell proliferation markers in the crypts and TZ in the DSS-treated mice. Representative images showing nuclear expression of LGR5 (a), Ki-67 (d), and SOX9 (g) in the TZ of the treated mice administered 5% DSS in drinking water for 6 days (Day 6), followed by withdrawal of DSS for 6 days (Day 12). The positive signals are visualized with 3,3′-diaminobenzidine as the chromogen (brown), followed by counterstaining with hematoxylin. Bar = 50 µm. Scatter plots with correlation coefficient (R2) and linear function (y = ax) between the number of positive cells in the crypts and TZ in the labeling of LGR5, proximal colon (b), distal colon (c); Ki-67, proximal colon (e), distal colon (f); and SOX9, proximal colon (h), distal colon (i). DSS, dextran sodium sulfate; LGR5, leucine-rich repeat-containing G-protein-coupled receptor 5; SOX9, sex-determining region on Y-box transcription factor 9; TZ, transitional zone.

