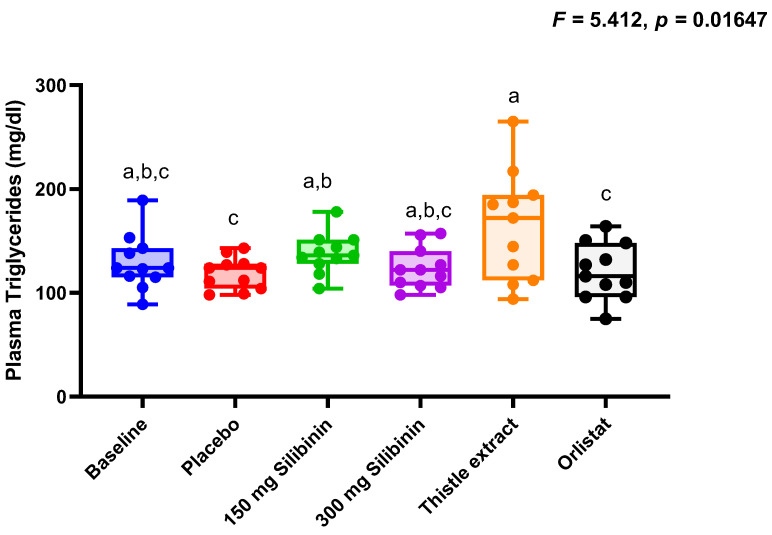
Figure 1.
Boxplots showing individual values of the plasma triglycerides throughout the different interventions. Statistical differences were evaluated by a one-way ANOVA. FDR was conducted to control for multiple comparisons. Significance level was p < 0.050, after adjustment, in all cases. Boxplots with different letters indicate statistically significant differences after adjustment.

