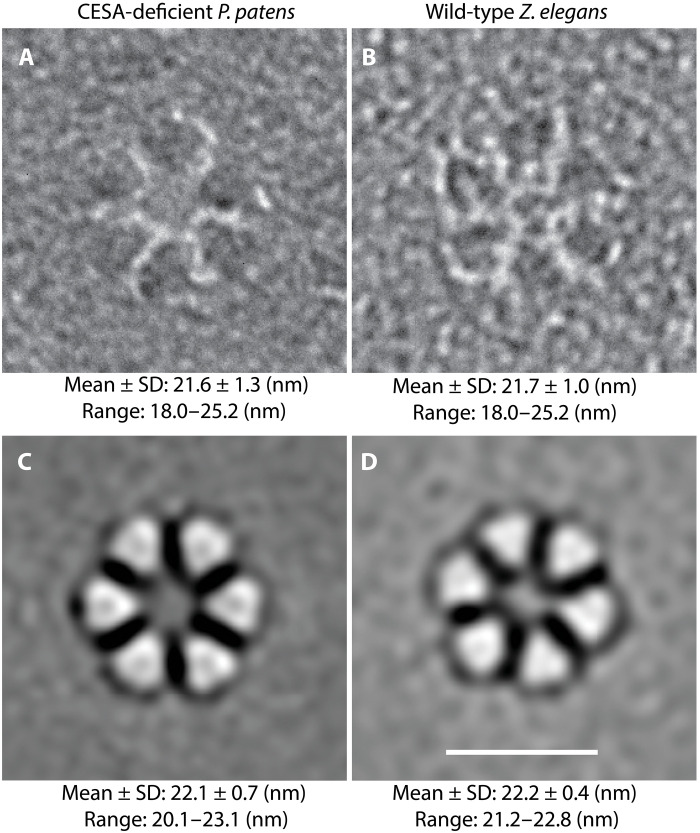
Fig. 4. Original images and corresponding image averages of rosettes from two cell types with diameter measurements.
(A) Original FFTEM images and data from hand measurement of 543 rosettes from nine CESA-deficient P. patens protonemal cells (three cells from each of three independent genetic lines) frozen while synthesizing primary cell walls. (B) Original TEM image and data from hand measurement of 380 rosettes from five differentiating tracheary elements frozen while synthesizing secondary walls via CESAs. (C and D) Representative image averages of the rosettes measured in (A) and (B). The contrast of the original images was reversed before reference-free image averaging to accommodate the design of the EMAN2 program. Data for each cell type are from hand measurement of the 42 image averages (six class averages within each of seven refinements). Scale bar, 20 nm.

