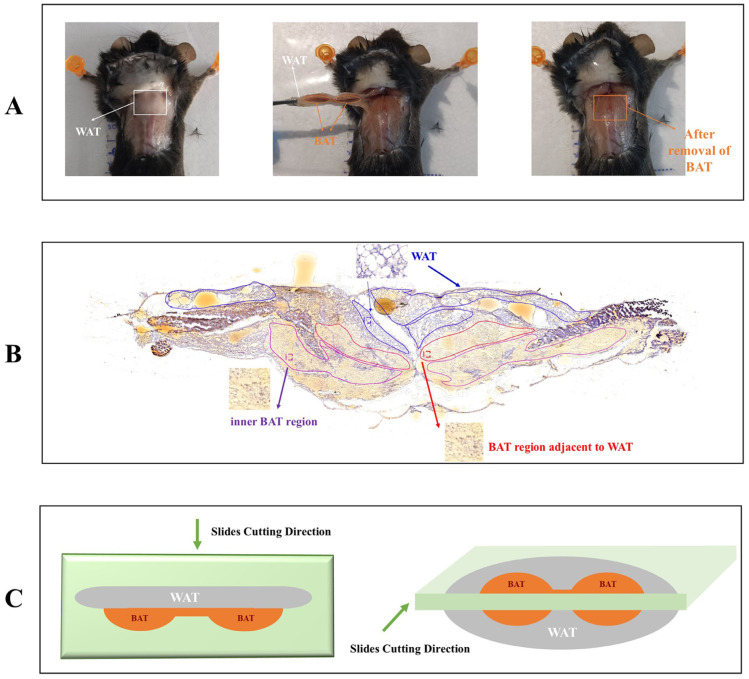
Figure 2.
Anatomy schematic and defined anatomical tissue regions. (A) Representative images of removal of interscapular BAT and adjacent WAT. Left: top view of interscapular BAT regions; middle: isolation of interscapular BAT and adjacent WAT; right: images after removal of interscapular BAT and adjacent WAT; (B) representative images of partitioning the WAT region, BAT region adjacent to WAT, and inner BAT region (bottom layer) according to the HE staining result. (C) Schematic diagram of slice cutting directions for spatial metabolomics (n = 3).

