Figure 3.
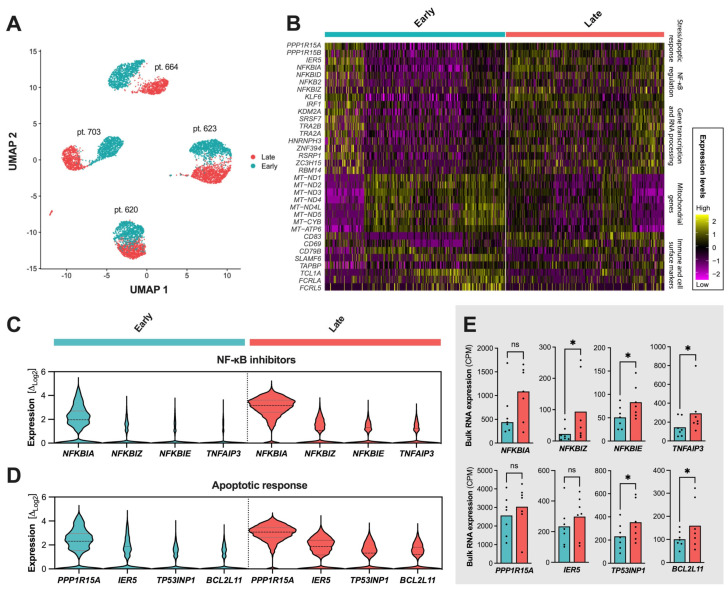
Transcriptional profile of ibrutinib treatment responses. Transcriptional landscape of single cells at early therapeutic follow-up (cyan: mean follow-up of 14 months) and prolonged administration (pale red: 36 months) (A–E). Significant expressional changes were identified in genes relating to the NF-κB inhibitor family, stress and apoptotic response, or mitochondrial oxidative phosphorylation (B). Increased expression or number of cells expressing NFKBIA and other NF-κB inhibitors after prolonged ibrutinib administration (C). Increased expression of PPP1R15, IER5, TP53INP1, and BCL2L11—genes involved in apoptotic regulation—at late ibrutinib response (D). Bulk RNA sequencing confirming upregulation trends in late follow-up samples for markers involved in B-cell signaling and survival (E). Abbreviations *: p < 0.05, ns: not significant. Dotted lines in (C) separate early and late response profiles. Dots in (E) show individual expression levels for the bulk RNA sequencing samples when expressed.

