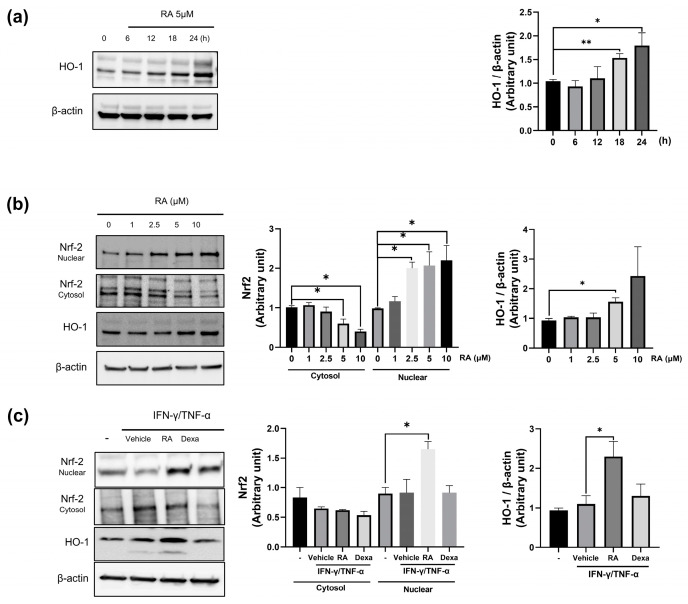
Figure 5.
RA-induced Nrf2 and HO-1. (a) RA increases HO-1 expression in keratinocytes in a time-dependent manner; (b) RA increases cytosolic HO-1 and nuclear Nrf2 levels but decreases cytosolic Nrf2 levels in a dose-dependent manner. HO-1 and Nrf2 levels were quantified by densitometric analysis. Nrf2 and HO-1 levels were examined in keratinocytes after RA (1, 2.5, 5, or 10 μM) treatment; (c) RA increases nuclear Nrf2 and cytosolic HO-1 levels in cells treated with IFN-γ/TNF-α (I/T) (10 ng/mL). Vehicle: DMSO-treated cells; RA: RA (5 μM)-treated cells; Dexa: dexamethasone (20 μM)-treated cells. The quantified Western blot data are shown as the means ± standard deviations (SDs) (n = 3). * p < 0.05, and ** p < 0.01 vs. the vehicle-treated cells as determined by two-tailed t tests.

