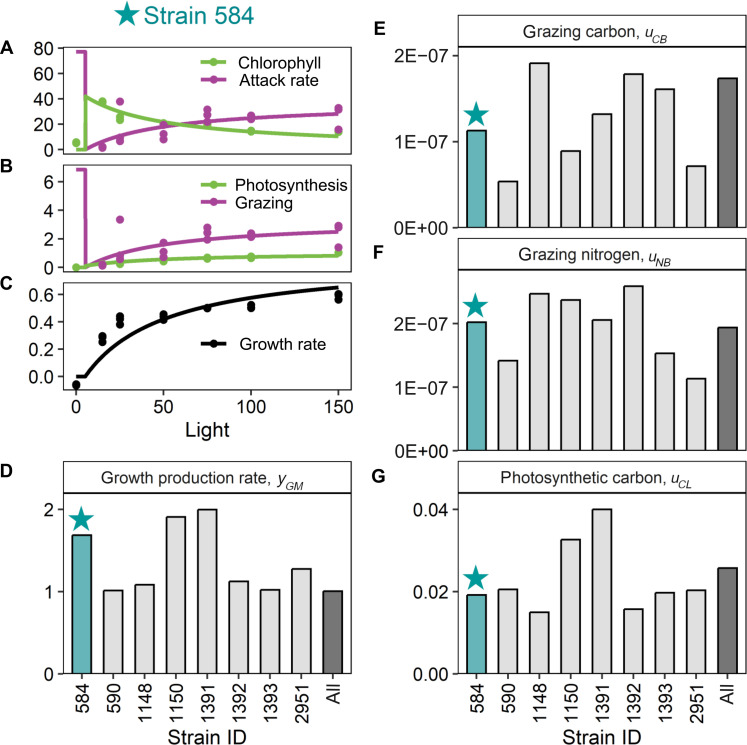
Fig. 3. The MOCHA model reproduces patterns in empirical data.
The MOCHA model reproduces patterns in empirical data. We use data from eight strains of Ochromonas to parameterize our model. Here, we show empirical data (points) and model fits (lines) from strain 584 as an example [(A) to (C)]; data and model fits from all strains are given in fig. S5. Empirical data include the following: (A) photosynthetic investment (chlorophyll content per Ochromonas biomass, mgChl gC−1) and heterotrophic investment (attack rate, a.k.a. “clearance rates,” in units of ml per Ochromonas biomass per day, ml gC−1 day−1), (B) photosynthetic rate (carbon fixed per Ochromonas biomass per day, gC gC−1 day−1) and grazing rate (bacteria per Ochromonas per day, CFU μgC−1 day−1), (C) and growth rate (day−1). On the basis of the model fits, we were able to estimate different parameters in MOCHA [(D) to (G)]. The estimated parameters for strain CCMP 584 (blue bars) were derived from the model fits shown in (A) to (C). The gray bars indicate how variable these parameters were across different strains while the black bar reports the estimated values for an “average Ochromonas cell” based on a global fit to pooled data from all eight strains. Strains varied in their growth factor production rate [, day−1 (D)]; carbon acquisition from bacteria in carbon acquired per carbon vacuole structure, day, and bacteria density [, gC gC−1 day−1 (CFU ml−1)−1 (E)]; nitrogen acquisition from bacteria in nitrogen acquired per carbon vacuole structure, day, and bacteria density [, gN gC−1 day−1 (CFU ml−1)−1 (F)]; and photosynthetic carbon acquisition in carbon acquired per carbon plastid structure, day, and light intensity [, gC gC−1 day−1 (μmol quanta m−2 s−1)−1 (G)].

