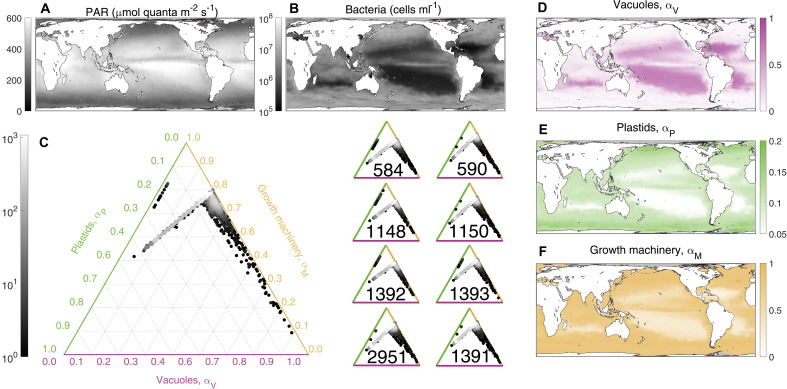
Fig. 4. Global distributions of mixotroph strategies.
Light (A) and bacteria (B) resource drivers of the model, interpolated from satellite observations and the output of the Darwin model, respectively. Ternary plots (C) show the global distribution of mixotroph strategies in investment space. Shading represents frequency across the global domain, with brighter points indicating a more widespread strategy. The larger ternary plot (left) shows the simulation assuming an average Ochromonas cell with the strategy for each of the individual Ochromonas strains given by the eight smaller ternary plots (right). Maps of optimal investments in digestive vacuoles [ (D)], plastids [ (E)], and growth machinery [ (F)] are given for a mixotroph with uptake, production, and assimilation traits modeled after an average Ochromonas cell. Note the different axes for the color bar range, chosen to highlight global variability in investment strategy. To generate the bacterial abundance, we assumed a uniform ratio of 10 fg C per bacterial cell.

