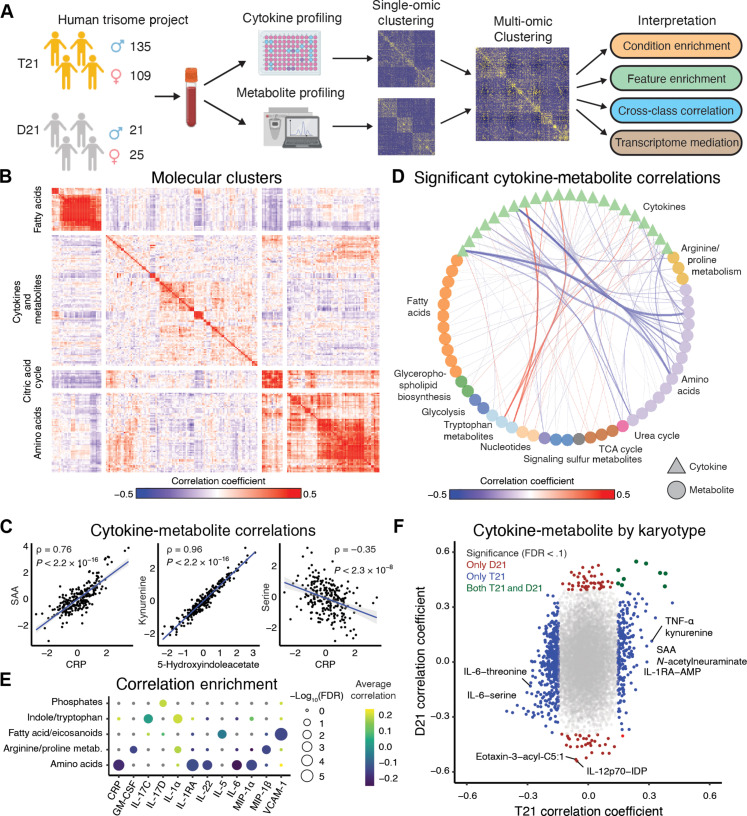
Fig. 1. The immunometabolic profile of DS differs from the general population.
(A) Overview of analysis workflow. Whole-blood samples collected from individuals with T21 and D21 karyotypes were used to quantify plasma cytokines and metabolites. Individual-omic profiles were evaluated and an integrated analysis was performed. Identification of gene mediators of cytokine-metabolite relationships was performed, and immunometabolic subgroups were defined. Further analysis was performed on the subgroups. (B) Heatmap of Spearman correlation coefficients between standardized cytokine and metabolite abundances. Clustering with k-means defined four groups. (C) Representative scatterplots of standardized values between cytokines, metabolites, and across molecular assay type. Blue lines represent the lines of best fit between the features; gray areas represent the 95% confidence interval. Spearman correlation statistics are reported. (D) Statistically significant (FDR < 0.1) correlations between cytokines and metabolites, aggregated by metabolite class. The thickness of the edges between nodes represents the absolute value of aggregated correlations coefficients. (E) Overrepresentation enrichment of significant correlations between cytokines and metabolites (FDR < 0.1) annotated to metabolite classes using a Fisher’s exact test. (F) Spearman correlation coefficients between cytokines and metabolites in people with T21 and D21. Points are colored blue if the relationships are only significant (FDR < 0.1) in T21, red if they are only significant in D21, and dark green if they are significant in both T21 and D21 individuals. GM-CSF, granulocyte-macrophage colony-stimulating factor; FDR, false discovery rate; CRP, C-reactive protein; IL-17C, interleukin-17C; VCAM-1, vascular cell adhesion molecule–1; AMP, adenosine 5′-monophosphate; IDP, inosine 5′-diphosphate; SAA, serum amyloid A.

