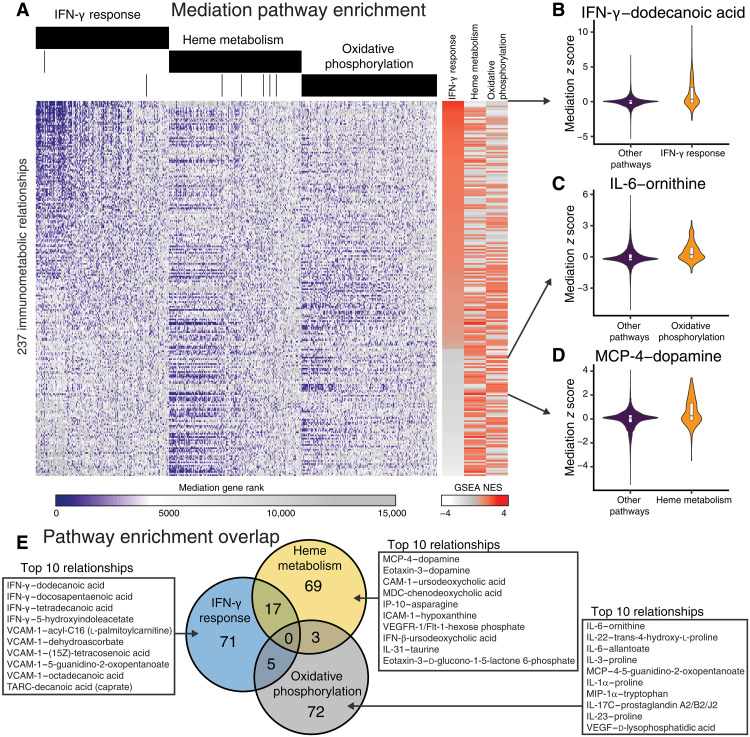
Fig. 3. Mediation analysis reveals signaling pathways driving cytokine-metabolite relationships in DS.
(A) Gene mediation rankings over all genes for cytokine-metabolite relationships. Genes (x axis) are ordered by aggregate ranking across immunometabolic relationships and separated by pathway annotation. Cytokine-metabolite relationships (y axis) are ordered by the normalized gene set enrichment scores IFN-γ response pathway genes. (B to D) Mediation scores for the immunometabolic relationship most enriched for mediation by (B) IFN-γ response, (C) oxidative phosphorylation, or (D) heme metabolism. (E) Overlap of cytokine-metabolite relationships with significant enrichments for gene mediation in IFN-γ response pathway genes, heme metabolism, and oxidative phosphorylation. The top 10 significant relationships specific to each pathway are listed in the insets. GSEA, gene set enrichment analysis; NES, normalized enrichment score.

