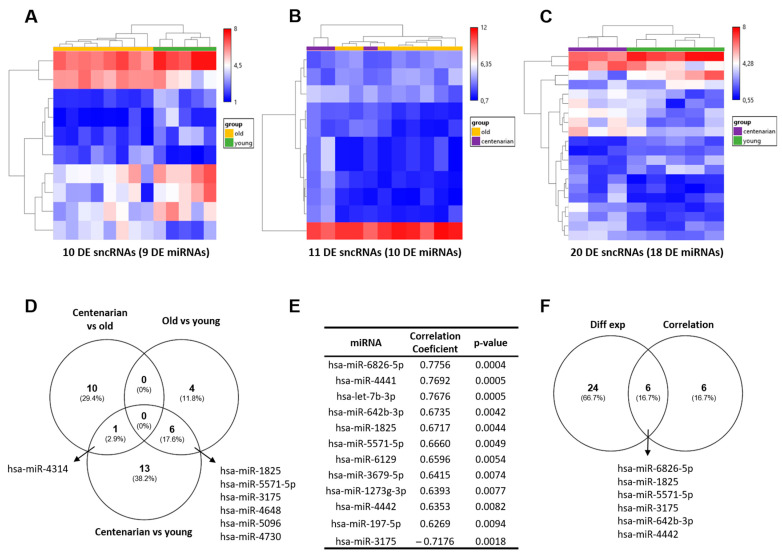
Figure 1.
Statistically significant sncRNAs from post-mortem hippocampal RNA samples. Unsupervised hierarchical clustering of the log2 expression value of the DE sncRNA obtained between (A) old vs. young, (B) centenarian vs. old, and (C) centenarian vs. young. Of note, using a p-value < 0.05 and FC ≥ |2|, DE sncRNAs revealed are principally miRNAs. (D) Venn diagram showing DE sncRNAs that overlap among the comparisons. (E) Twelve mature miRNAs that present a significant positive (11 miRNAs) and negative (1 miRNA) correlation with age using a p-value < 0.01 and r > |0.6| as the cut-off. (F) Venn diagram of the mature miRNAs revealed by DE and correlation analyses showing overlapping. DE: differentially expressed.

